DOGE Price Signals Buy Near Key Support as Oversold Pressure Grows

- DOGE holds the $0.12–$0.10 support zone as selling pressure slows on weekly charts.
- Momentum cools with RSI near oversold, while traders watch short-term wedge signals.
- On-chain data stays flat as open interest and futures volume trend sideways.
The DOGE price spent most of the week drifting lower, extending a long stretch of selling that has worn down sentiment across its market. By press time, the token traded near $0.1214, down 1.16% on the day and 4.54% through the week.
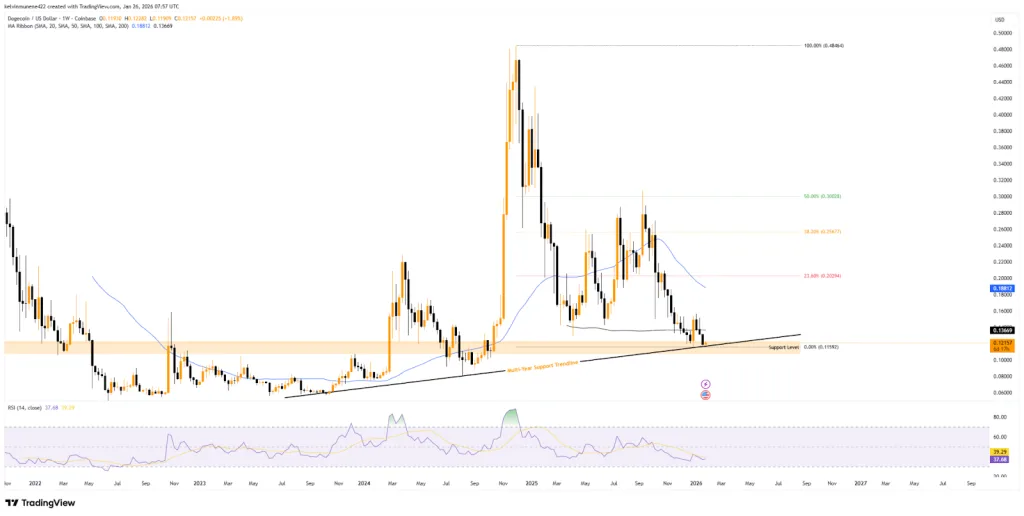
Its year-on-year slide, a steep 65.77%, underscores just how prolonged the drawdown has been. Traders, however, are beginning to pay closer attention to where it has landed. That level, a familiar pocket around $0.12 to $0.10, has acted as a floor in several prior cycles.
The market has returned to it once again, and even with broader weakness in place, the zone has started to behave as it usually does, absorbing pressure rather than giving way immediately. Early weekly data shows a modest shift in tone, with buyers tentatively responding as the candle begins to firm up.
Support Zone Holds as Momentum Cools Near Oversold Levels
Three straight weeks of declines pushed Dogecoin right onto that high-traffic support band. The area overlaps a long-running trendline dating back to mid-2024, one that has repeatedly cushioned the DOGE price during heavier sell-offs. It is not a guarantee of recovery, but the market has treated it as a reset zone before.
This week’s pattern suggests a similar dynamic. The chart shows a slower pace of selling as candles narrow, hinting at traders testing the bottom rather than accelerating toward it. Compared with more aggressive declines earlier in the month, the shift stands out.
Momentum readings add another layer to the setup. The relative strength index stood near 37 at press time, indicating stronger selling pressure than buying pressure. While this level does not yet confirm a reversal, it places the market closer to the traditional oversold threshold of 30, where downside momentum has historically weakened.

Short-term charts also reveal a broadening falling wedge, an untidy but often telling formation that can appear when markets lose steam in their downtrends. Here, it aligns with the same support zone, giving analysts an additional reference point as they track the DOGE price reaction.
Moving Averages Define the Barriers Ahead for DOGE
However, any sustained improvement depends on reclaiming several nearby technical markers. The 200-period moving average at roughly $0.13 is the first checkpoint and likely the earliest sign that momentum is shifting. Further up, the 50-period moving average near $0.18 sits close to the 23.6% Fibonacci area around $0.20.
Until those levels are back in play, the chart leans decisively toward sellers. Still, holding the current floor prevents a deeper breakdown, and that alone matters in a market that has been under pressure for months. If the DOGE price slips below the zone, the structure opens a path to lower territory.
Related: XRP Price Steadies Above Key Support: Is a Rebound Past $2 Possible?
Analyst Parallels Emerge as On-Chain Activity Stalls
Analyst Trader Tardigrade highlighted similarities between the current correction and a previous pullback on the weekly DOGE/USD chart. According to his analysis, both the declines saw roughly a 59.17% drop stretched across 19 weekly candles.
The earlier drawdown was followed by a sharp upside move, highlighted on the chart with a steep advance. Based on that comparison, Trader Tardigrade suggested the recent sell-off may have already run its course.
If the pattern holds, the analyst sees scope for DOGE to transition from consolidation into a fresh bullish phase, with a longer-term target range marked between $0.58 and $0.64. Meanwhile, on-chain metrics suggest consolidation rather than renewed volatility.
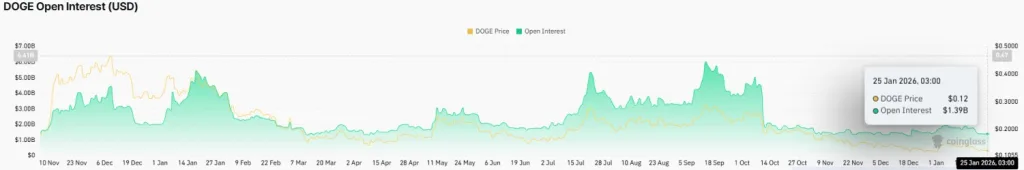
Open interest hovered around $1.39 billion and moved sideways, while futures trading volume remained range-bound near $2.06 billion. Neither metric shows renewed speculative engagement.
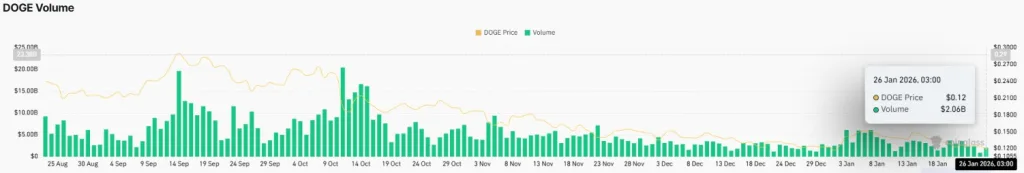
Instead, they suggest traders are sitting still, waiting for something more decisive to develop. For now, the DOGE price rests at a critical junction, oversold, heavily discounted, and lodged against a support level that has mattered before.