
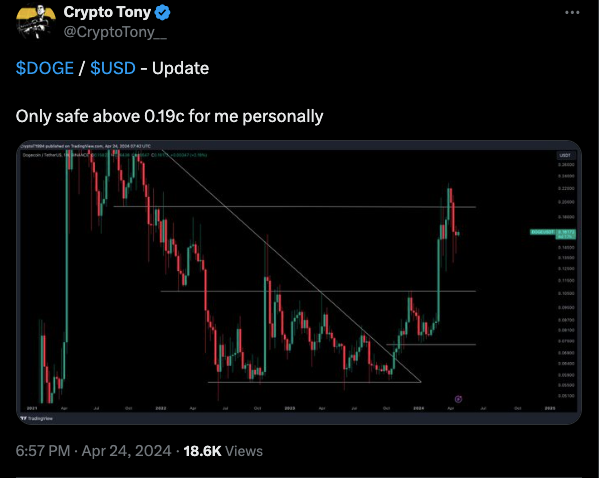
Dogecoin has been highlighted as one to watch with its current positioning showing a critical level at $0.19, according to crypto analyst Crypto Tony. This sentiment has been echoed in an X post, suggesting that a sustainable move above this price point could be a sign of strength.
The analysis points to the possibility of a trend change but maintains a cautious stance until Dogecoin consistently trades above the $0.19 threshold.
Dogecoin, the popular meme-based digital currency, recently faced a notable decline, interrupting its brief bullish phase. Over the last 24 hours, it recorded a 6.38% drop in its price, now standing at $0.1514. Previously, the cryptocurrency had shown signs of a positive trend, but this was quickly reversed into a bearish pattern.
Despite the downturn, Dogecoin retains a robust market presence with a capitalization of $21.84 billion, securing its spot as the eighth-largest cryptocurrency. Moreover, its trading volume has spiked by 28.54%, reaching $1.42 billion. This surge suggests that traders are becoming increasingly active, possibly capitalizing on the price movements.
Over the past week, the Dogecoin price has seen a surge in price with more than a 5% increase in overall value, indicating that despite the short-term setbacks, there remains a degree of investor confidence and interest in the cryptocurrency’s potential for recovery. DOGE has been trading in a range of $0.14-$0.16, with bulls and bears struggling to gain the market momentum.
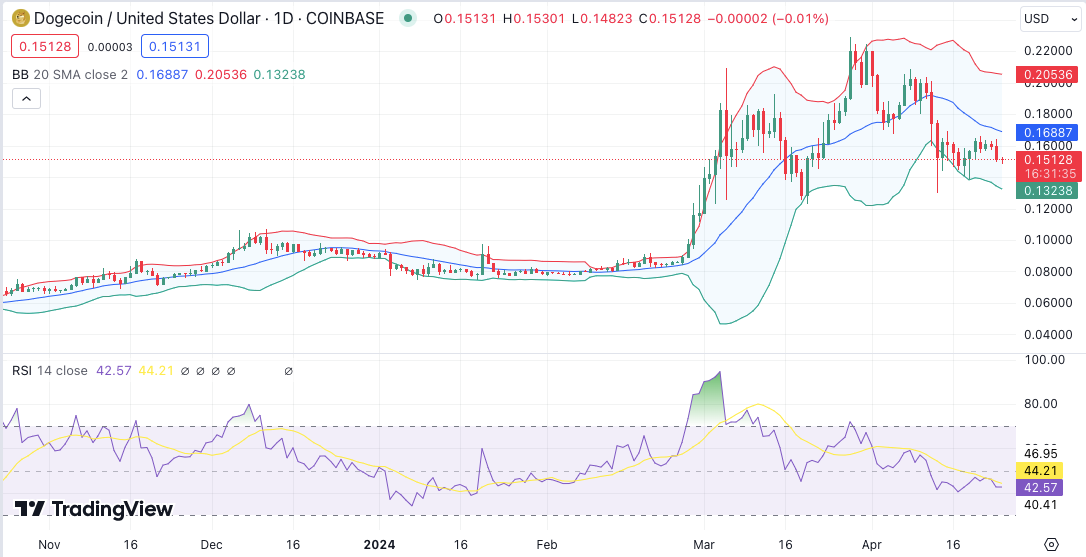
The 24-hour technical indicator for the meme-coin reveals a stabilized trading pattern within defined margins. Notably, the Bollinger Bands signal a narrowed volatility range, with the upper band at approximately $0.2053 and the lower band around $0.1323. Additionally, the Relative Strength Index (RSI), at 42.57, suggests a balanced sentiment among traders, neither overbought nor oversold.