


- Dogecoin’s current market shows a large high-time-frame range, indicating significant trading opportunities above $0.08750.
- For a confirmed uptrend, Dogecoin needs to surpass its December 2022 high of $0.11 and maintain a higher low.
- Skew’s analysis focuses on crucial price points for potential profit in Dogecoin, emphasizing the importance of strategic entry and exit.
Dogecoin, a popular cryptocurrency, is currently exhibiting a significant high-time-frame (HTF) range, according to insights from renowned crypto trader and analyst Skew. The analyst suggests that entering positions above $0.08750 could be more advantageous for those looking to maximize their risk-reward ratio. This threshold is seen as a pivotal point, beyond which the potential for profit increases notably in the Dogecoin market.
Further dissecting the cryptocurrency’s market structure, Skew pointed out that observing specific price movements could confirm a technical uptrend. A critical indicator would be Dogecoin forming a higher high (HH) above its December 2022 peak, around $0.11.
Additionally, establishing a higher low, potentially around $0.094 or near the December 2023 high, would further reinforce the uptrend. This analysis suggests that careful monitoring of these price points could be key for traders looking to capitalize on Dogecoin’s market dynamics.
Dogecoins DOGE token has recently exhibited a constrained trading pattern, fluctuating between $0.075 and $0.079. This situation has seen bearish tendencies gaining some traction. If this bearish momentum persists, DOGE could potentially descend to a $0.070 level. Conversely, as some analysts have started predicting, a shift in market dynamics favoring the bulls might propel DOGE towards a $0.0800 mark, with a further possibility of escalating to $0.08750 in a short timeframe.
Dogecoin, the popular memecoin, is currently experiencing a period of consolidation, trading at a value of $0.07886. In recent hours, the digital currency has witnessed a slight decline of 1.25%, hinting at a bearish influence in the market. Despite this minor setback, the trading volume for Dogecoin has impressively surged to $933 million. The current market capitalization for DOGE has dipped to $11 billion. This valuation still secures Dogecoin a place in the top 10 cryptocurrencies by market capitalization.
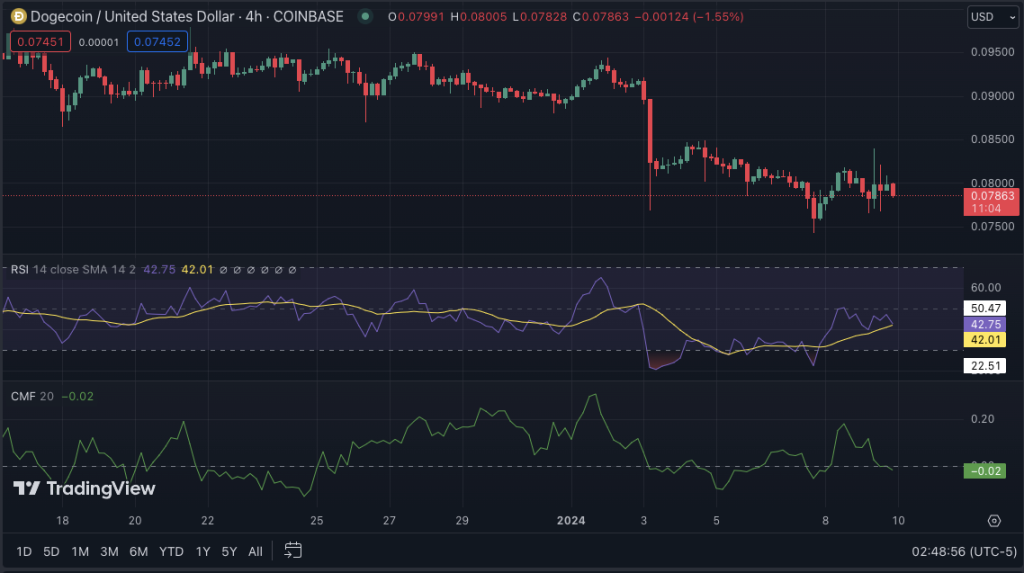
In terms of technical analysis, the indicators present a mixed but mostly optimistic outlook. The Relative Strength Index (RSI) on the hourly chart hovers just below the neutral line at the 42 level, suggesting a balanced force between buyers and sellers. The Moving Average Convergence Divergence (MACD) on the 4-hour chart is edging toward bearish territory, which could signal an upcoming positive trend reversal in the near future. However, the Chaikin Money Flow index is negative at -0.02, indicating a dominant selling sentiment among investors. Additionally, both the 20-day Exponential Moving Average (EMA) and the 50-day EMA show bearish trends, indicating that bulls find it challenging to drive the momentum.


