
Cryptocurrency prices harness modest gains on Monday. A stronger U.S. data and doubts over the fate of the Genesis trading platform kept traders on their toes
- Ethereum price lost over 1% after initial gains on Monday.
- Bears challenge the critical 200-day moving average on a 2-hour chart.
- Expect a bounce back from the 0.61% Fibonacci retracement level amid a range-bound trading movement.
Ethereum (ETH) started the fresh trading week on a higher note but was not able to defend the gains. ETH’s price gained momentum and recaptured the $1,300 mark. However, a late recovery in the U.S. dollar kept the upside pressure intact in the second-largest cryptocurrency.
The U.S ISM Services PMI unexpectedly rose to 56.5 in November against the market expectations of 53.3. The U.S. equity market extend the losses as the Dow lost 1.21%, and S&P 500 was down by nearly 2%. Better-than-expected data drenched hopes for a break in the Fed’s aggressive monetary policy.
As of writing, ETH/USD is exchanging hands at $1,263, down 1.23% for the day. The 24-hour trading volume jumped to $6,377,040,220 as per CoinMarketCap.
Ethereum price looks for support near $1,240
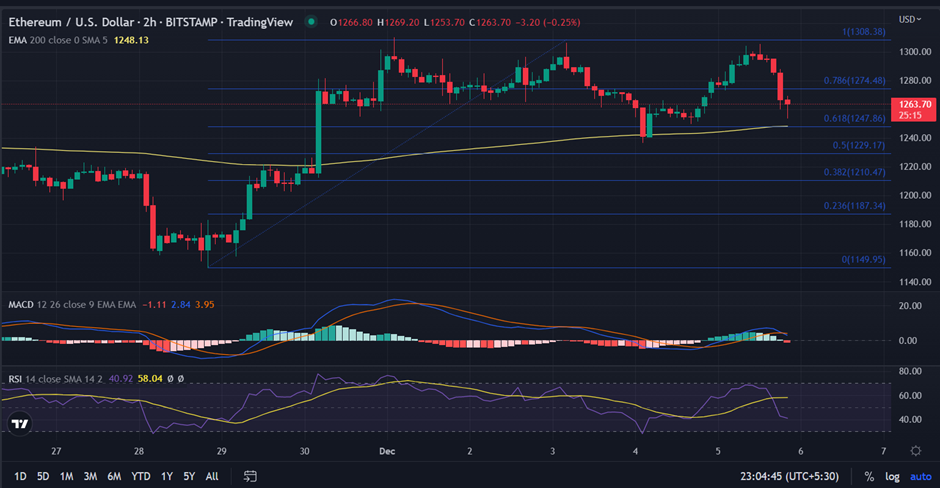
On the 2-hour chart, the Ethereum price formed a “Triple Top “pattern, a bearish technical formation near $1,305. The price retreated after testing the high of $1,305. However, the formation of the ‘Hammer’ candlestick pattern around $1,253 paused the fall in the asset.
Currently, the bulls attempts a recovery toward $1,280 amid the formation of the bullish candlestick pattern. Traders continue to face challenges near the $1,300 level since November 11. If the ETH price closes above $1,280 in the 2-hourly time frame, then there is a higher chance it could retest $1,300.
Further, a daily close above $1,310, a high of December 1 would see more gains toward $1,400.
On the other hand, a sustained selling pressure near the higher level, and if the price stays below $1,250 for a longer period then bears would have more chances to take over the trade.
On moving lower, the Ethereum price could test the 200-day EMA (Exponential moving average) at $1,248. This also coincides with the 0.61% Fibonacci retracement level, extending from the low of $1,149.40 made on November 28.
Additional participation from the sellers could drag the price lower toward the 0.50% Fibonacci retracement level placed at $1,229.17.
Technical indicators:
RSI: The 2-hourly RSI reads at 41 with a neutral bias. Any downtick in the oscillator would support the downside momentum in the price.
MACD: The indicator trades above the central line with a bearish crossover, signalling the presence of sellers.
Conclusion: Ethereum price trades in a predefined range of $1,250 and $1,310 in the short term. A breakdown of the range would dictate the next directional setup.