
HBAR has recently marked a significant milestone in its journey within the cryptocurrency market. After years of following a symmetrical trendline, the digital asset has embarked on a bullish trajectory, aiming to hit several key financial targets in the near future. The ascending pattern observed in HBAR’s price movement has set the stage for potential gains, with the first goal set at $0.56, followed by a more ambitious target of $1.20. Moreover, the ultimate aim is to reach a peak of $1.79, signaling strong confidence from investors and analysts alike.
The surge in HBAR’s market value is notable, with its capitalization now at $3.19 billion. This breakthrough has exemplified the cryptocurrency’s resilience and ability to outperform within a highly competitive and volatile market. Consequently, this upward movement reflects a broader trend of increasing investor interest and market validation for HBAR.
Looking at Hedera’s current market performance, HBAR is trading on an upward trajectory. HBAR has formed a triangular ascending pattern on the daily and weekly charts, with the price aiming for new highs. As of this writing, HBAR is exchanging hands at $0.09513, up by over 10% in the past 24 hours. HBAR has gained 20% on the weekly timeframe, while the monthly gain stands at 25%.
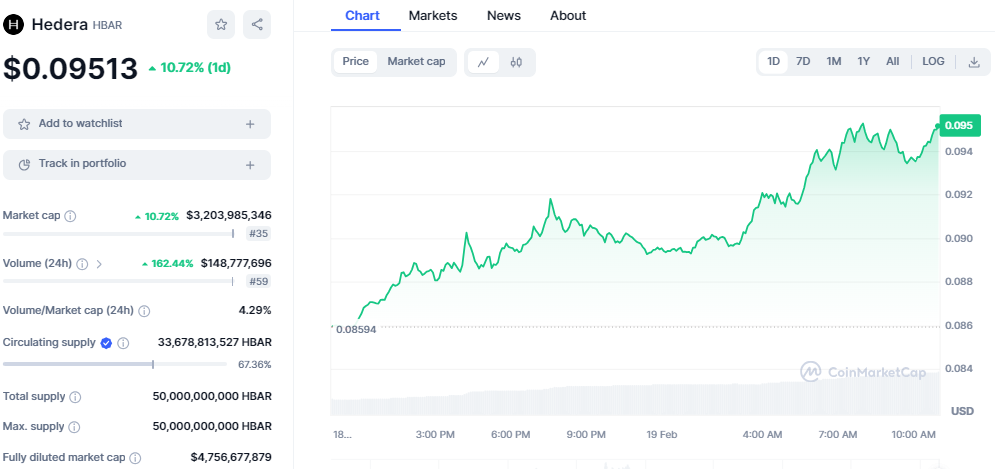
HBAR’s daily trading volume is increasing, indicating a rising momentum in the buying pressure. An increase in buying pressure suggests that the buyers are on top of the sellers at the moment as the price continues to rise. The daily trading volume is at $146 million, displaying an increase of 160% since yesterday’s close.
On the technical front, HBAR paints a strong, bullish outlook. Indicators such as the Relative Strength Index (RSI) and the Moving Average Convergence Divergence (MACD) have climbed steadily northwards, supporting the current uptrend. The RSI is at an elevated level of 75 index, indicating an overbought region, which could however lead to correction in the coming sessions.

The MACD indicator is climbing above the signal line, which suggests a rise in buying pressure as the buyers take the lead. The histogram forms a series of green bars in the positive region, indicating a strong bullish momentum that could push the price higher. In addition, HBAR has formed strong support at the 10-day Exponential Moving Average, indicating a buying signal as the price continues to rally high.


