- Litecoin’s price has climbed back over the $70 threshold, marking a notable recovery since late January.
- Despite the quiet trading volume, Litecoin’s position as the 19th largest by market cap hints at underlying strength.
- The cryptocurrency’s RSI reaching a two-month high may indicate growing investor confidence and potential for upcoming market activity.
Litecoin has recently seen a notable increase in its market value, crossing the $70 threshold for the first time since January 22. This development marks a mild yet significant rebound for the digital currency, currently positioned as the 19th largest asset by market capitalization. Despite the subdued trading volume, this upward movement in Litecoin’s value warrants attention, as it might foreshadow broader market trends.
Santiment, an on-chain and social metrics platform, spotlighted the recent developments in Litecoin through a post on X.
Even with this positive price movement, Litecoin’s trading volume has not seen a corresponding increase. This stagnation in trading activity could suggest that the market is still in a phase of cautious observation. However, it also means that any sudden increase in trading volume could lead to more pronounced price movements, either upward or downward.
An important factor to note is Litecoin’s Relative Strength Index (RSI), which has reached its highest point in two months. This indicator is often used to gauge the momentum behind a cryptocurrency’s price movement and signal whether an asset is overbought or oversold. The current RSI levels suggest that investor sentiment around Litecoin is becoming more positive, potentially setting the stage for further gains.
Litecoin is currently exchanging hands at $71.10, up by over 3% in the past 24 hours. The rise in Litecoin’s market coincides with the wider crypto market uptrend led by Bitcoin, which has just breached the $46k threshold. Amid consolidating around the $67 to $69 range over the past week, LTC has recorded a 5% increase in the weekly time frame, while the monthly gain is at 6%.
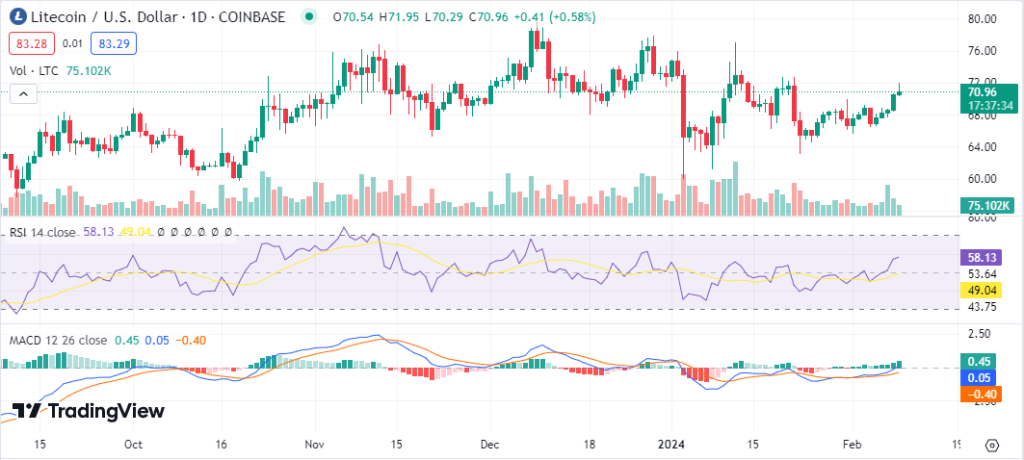
Technical indicators on the daily chart suggest a bullish outlook as most indicators head toward the upper side. The Relative Strength Index is steadily climbing from the neutral region heading to the overbought region at the 58 index. Moreover, the Moving Average Convergence Divergence (MACD) has climbed from the negative region below the zero line as the MACD value turns positive at 0.06. Additionally, the histogram prints green bars as the MACD line climbs above the signal line, suggesting a strong bullish sentiment.
In conclusion, amid subdued trading volumes, Litecoin’s recent price recovery above $70 presents a nuanced picture of the current cryptocurrency market. While immediate trading activity remains low, the increase in Litecoin’s RSI indicates investors’ growing optimism. This development in Litecoin’s market dynamics offers a glimpse into potential future trends, underscoring the importance of monitoring such indicators for informed investment decisions.