
Major Cryptocurrencies are trading in red amid Fed and U.S economy uncertainty.
- Polkadot price trades with modest losses on Tuesday amid risk-off market sentiment.
- The dot price found support near $5.40 on the hourly chart, a bounce back is expected.
- However, a candlestick below $5.25 would invalidate the bullish outlook.
Polkadot (DOT) price analysis shows a limited price action with modest losses on Tuesday. The asset found vital support around $5.40, a break above this level could mean further gains for Polkadot in the short term.
After a stunt of brief recovery, the crypto market was back in red as investors remained anxious over the fight against inflation that might dent the sentiment for riskier assets. The crypto major, Bitcoin trades with modest gains below $17,000, and Ethereum edges lower near $1,250.
The DOT/USD price reads at $5.47, with 0.02% gains at the time of writing, and the trading volume has decreased by 11% over the past 24 hours. The global cryptocurrency market cap held mildly higher around $866 billion, gaining as much as 2% in the last 24 hours as per CoinMarketCap.
Polkadot price looks for reversal on the hourly chart
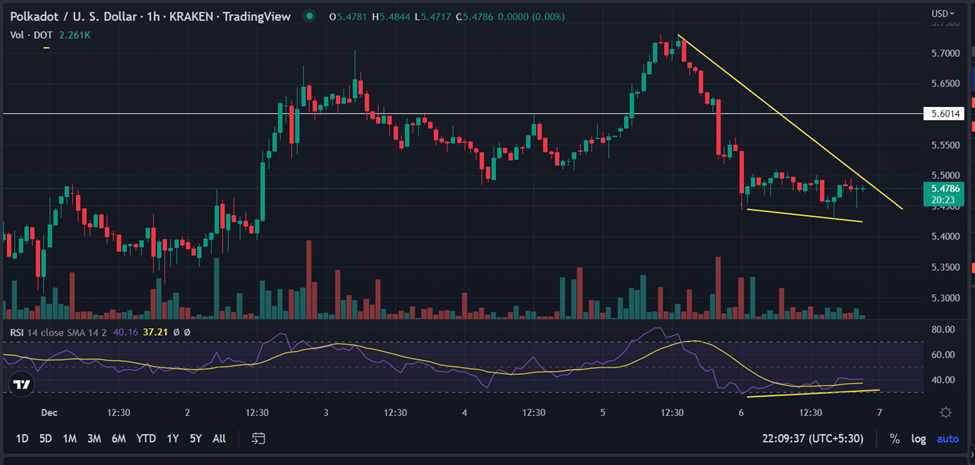
On the hourly time frame, the Polkadot price analysis indicates a sideways movement with a moderate bullish bias. The bearish trend line from the high of $5.70 acts as an upside barricade for the bulls. The formation of multiple Doji candlesticks suggests bulls are in the process of taking control.
If the price managed to breach the descending trend line we could expect an upside run toward the horizontal resistance zone placed at $5.60 followed by the previous day’s high of $5.74.
Conversely, a daily close below the $5.40 mark could strengthen the bear’s positioning. If that happens, the first lower target could be located at $5.35.
Next, the market participant would attempt to test the $5.25 mark.
Technical indicator:
RSI: The hourly RSI reads at 40 with a neutral to moderate bullish bias. A bullish divergence is seen that suggests the price could see an upside shortly.
Conclusion: Polkadot price analysis shows that the cryptocurrency might consolidate around $5.45 before continuing its upside movement. The hourly chart shows bullish momentum brewing up near the lower levels.