SHIB Bounces Back From a 10% Fall: Will This Recovery Last?

- SHIB rebounds from its lowest level in two years as buyers step in at major support.
- The falling wedge pattern and an RSI lift signal ease downside pressure for SHIB.
- Market activity stays muted, which raises fresh doubts about SHIB’s long-term momentum.
Shiba Inu (SHIB) kicked off the new week with a modest rebound after suffering losses throughout last week. While most large-cap cryptocurrencies continued to trade in the red, SHIB showed early signs of stabilization, posting a mild daily gain that has renewed short-term optimism among traders. Yet the bigger question remains: can this early recovery hold, or is it only a brief pause in a wider downtrend?
Market Turns Green as SHIB Posts a Mild Daily Gain
The overall market opened Monday with pockets of green. Many large assets moved less than 2% in the past 24 hours; nothing dramatic, but enough to suggest a cooling in selling pressure.
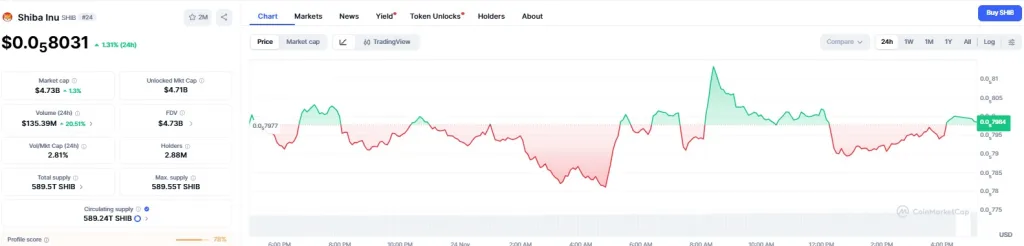
SHIB joined that group with a 1.31% lift, trading at $0.000008031 at the time of writing. Its market cap stands at roughly $4.73 billion, while trading volume climbed above $135 million, up 20% from the previous day.
The rise comes after SHIB lost more than 10% last week, adding to a wider 21% drop over the past month. The mild recovery helped calm sentiment, at least for now. Some traders view this early move as the first sign of buyers returning after a rough stretch.
A Falling Wedge and a Bounce From a Two-Year Low
SHIB has been sliding inside a descending falling wedge since mid-October, a pattern often associated with markets nearing the end of a downtrend. The price kept drifting lower inside this structure until it finally retested the wedge’s lower boundary last week.
That retest brought the token down to $0.00000754, its lowest point in nearly two years. Buyers stepped in quickly at that level, stopping the decline and forming the base for the current rebound. Momentum data adds more context.
The RSI rose from oversold levels to 34, indicating a slight decline in selling pressure. Moves from these levels often create room for short-term upside, simply because there is little space left for additional downside pressure.
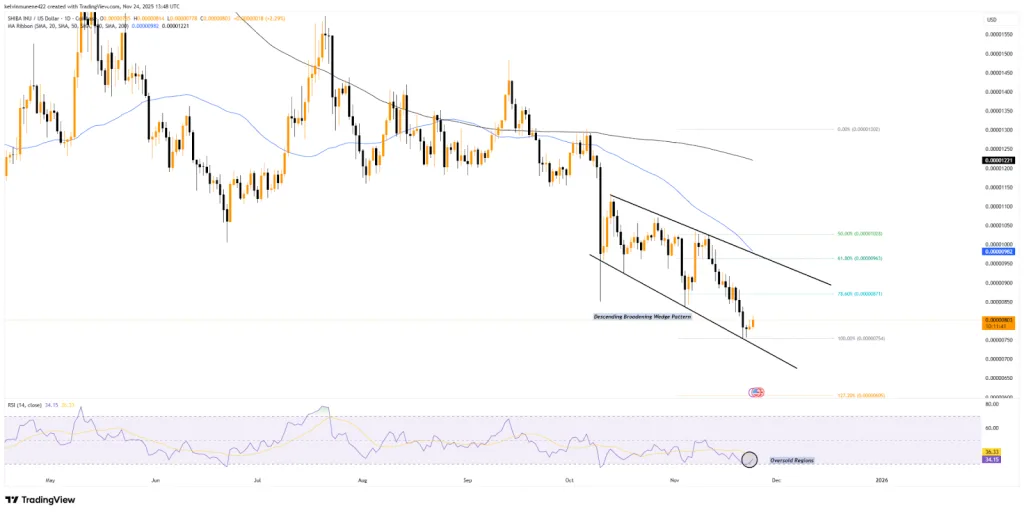
If the rebound holds, SHIB may attempt to revisit the 78.60% Fibonacci level at $0.00000871. A stronger move could carry it toward the 61.80% Fib level near $0.00000963, an area that previously acted as a ceiling.
Even with these targets in sight, the larger trend remains negative. SHIB still trades below the 50-day moving average ($0.00000982) and the 200-day moving average ($0.00001221). Both moving averages now serve as long-term resistance, reminding traders that the broader bearish structure has not been broken.
On-Chain Indicators Hint at Sluggish Participation
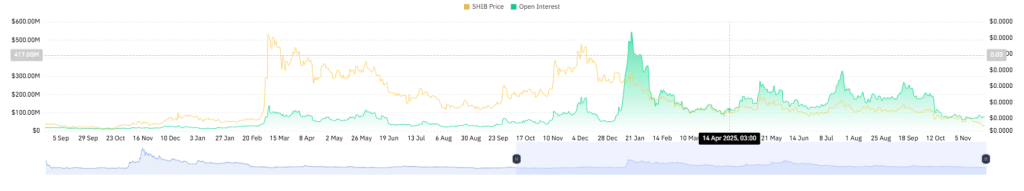
Despite the price improvement, on-chain activity is still slow. SHIB’s open interest has barely moved since mid-October, reflecting hesitation among derivatives traders. According to CoinGlass data, SHIB’s open interest has climbed from $77 million to just above $79 million, but the change is small and does not signal a surge in confidence.
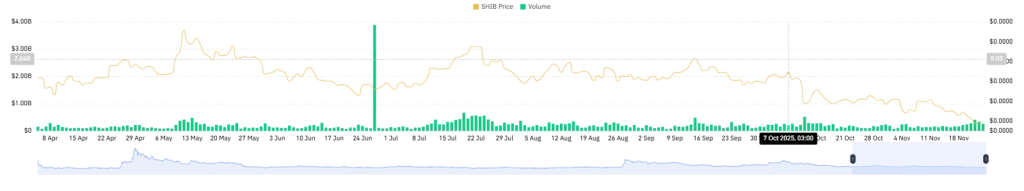
Derivatives volume remains muted as well, holding below $300 million, which suggests that traders are waiting for a clearer direction rather than taking new positions. These metrics show that the rebound may be driven more by spot demand at support rather than a broader shift in market participation.
For a sustained recovery, however, SHIB would likely need a stronger pickup in trading activity or a notable catalyst from the ecosystem or wider market.
Related: Bitcoin Cash Rallies by About 12% on Treasury Deal and Futures News
Can SHIB Hold the Line?
Shiba Inu’s rebound from its two-year low is a welcome change of pace after a rough month. The technical structure favors at least a short-term climb, and the RSI bounce strengthens that argument.
But the bigger trend has not shifted yet, and the lack of strong derivatives activity raises questions about how long the recovery can last. What happens next depends on whether new buyers step in or whether this bounce fades as quickly as it appeared.