Shiba Inu Holds $0.000012 as Market Awaits Key Breakout

- SHIB trades near $0.000012, with its market capitalization holding steady above $7.4B.
- Annual inflation dropped from 1.76 percent in May to 0.0027% in September 2025.
- The decisive resistance level remains at $0.000015, where buyers may regain control.
Shiba Inu (SHIB) trades at $0.00001255 at press time after a 0.56% daily gain. The price is near the 0.236 Fibonacci retracement at $0.00001262 while forming a downward wedge since mid-July that caps resistance at $0.00001378 and stretches support toward $0.00001158, creating a narrow band that could dictate the token’s next major move.
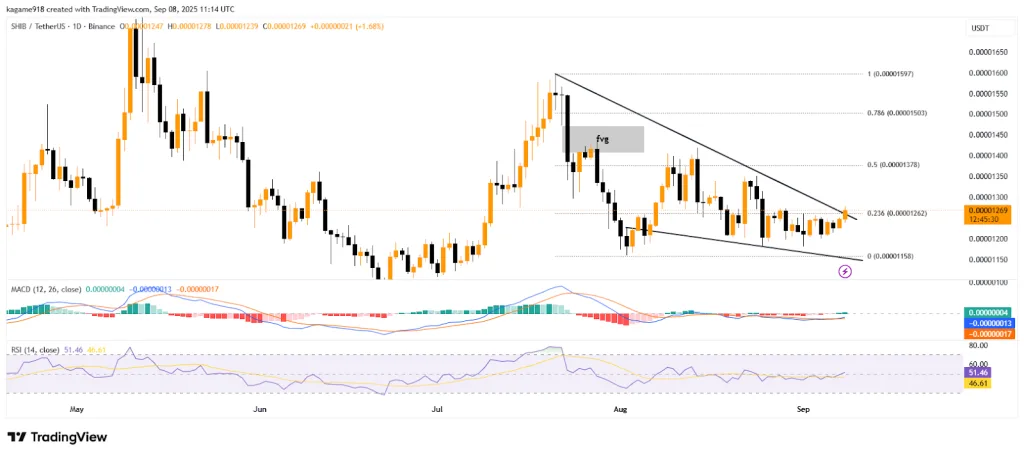
From a broader market perspective, SHIB climbed to $0.00001597 in July before retreating, with sellers exerting pressure near the $0.00001450 rejection zone. The strong resistance has led to price consolidation, with recent candles forming within tightening ranges. Traders are now watching for a breakout or breakdown that could either drive SHIB back toward $0.00001503 or push it down closer to $0.00001158.
Momentum indicators suggest a neutral stance. The MACD remains flat with a narrow gap between lines, recording a MACD value of -0.00000014, a signal at -0.00000017, and a histogram at 0.00000003, reflecting a market waiting for higher volume to establish direction. At the same time, the Relative Strength Index sits at 49.74, just below the neutral 50 line, reflecting balanced sentiment without a clear bias for either bulls or bears.
Market Data Reflects Supply Stability
According to on-chain data provided by Santiment, Shiba Inu is trading at $0.000013 at a market capitalization of $7.41 billion. The inflation rate of the token, which soared to 1.76% in May, is currently at 0.0027%, meaning traders will face less pressure from supply. Such shifts reflect less stormy market dynamics, with SHIB continually moving in and out of rallies and sharp corrections since March 2025, with the highest point of around $0.000017 in early May and then sharp downfalls to the areas around and below $0.000012.
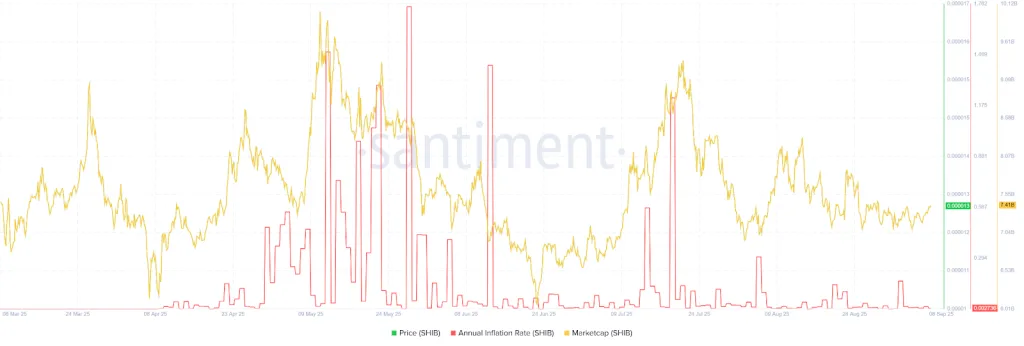
SHIB attempted a breakout at the same level in July, briefly surpassing $0.000015, but retreated as its market cap dropped below $8.0 billion. With inflation nearly at zero, volatility continues to shrink, and prices are tightening. Such levels will decide if SHIB regains bullish momentum or slips into deeper correction zones.
Related: SHIB Faces Decisive Support Zone With 17X Rally on the Horizon
Liquidity and Supply Near Limits
Data from CoinMarketCap shows SHIB is trading at a 2.68% yearly decline. The market cap stands at $7.43 billion, supported by a fully diluted valuation of $7.41 billion. Trading volume increased 42.67% in the last 24 hours to $154.67 million, lifting the volume-to-market cap ratio to 2.06%. SHIB’s circulating supply stands at 589.24 trillion, just below the maximum of 589.55 trillion, leaving little room for additional inflation.
The one-year chart shows a December 2024 high of over $0.000030, followed by a decline in early 2025. As supply remains almost depleted and liquidity is steady, the critical resistance point at $0.000015 may spell out whether SHIB gets back on the bullish movement or continues to be squeezed in its current wedge.