Bitcoin ETFs Face $4.5 Million Outflow as Tariffs Hit Markets

- Bitcoin ETFs lost $4.5 million as traders reacted to newly enacted China tariff plans.
- IBIT gained $74 million in inflows, showing steady interest from large investors.
- Bitcoin price dropped to $112,000, but high volume showed strong market activity.
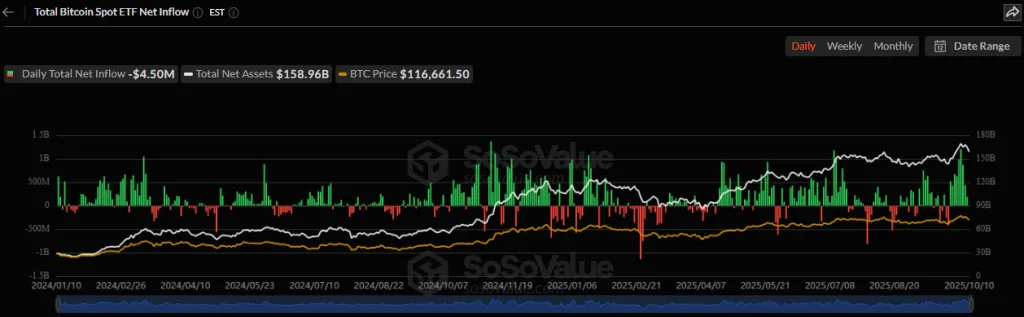
“Uptober” saw red for crypto, with over $19B liquidated. Bitcoin Spot ETFs recorded $4.5M in daily outflows, reflecting institutional caution amid heightened volatility. The shift followed President Donald Trump’s confirmation of a 100% tariff on imports from China, sparking widespread market anxiety and triggering one of Bitcoin’s sharpest declines in months.
IBIT Leads ETF Flows Amid Widespread Outflows
Even with the market turbulence, BlackRock’s iShares Bitcoin Trust (IBIT) was the leader in the ETF inflows with $74.2 million in daily inflows, which raised its total to $65.26 billion. On the other hand, Fidelity’s FBTC and Grayscale’s GBTC experienced outflows of $10.18 million and $19.21 million, respectively.
Market analyst Liu commented that Trump’s tariff threat was “more of a negotiation tactic than a policy pivot—classic pressure play.” He added, “Markets may flinch short term, but smart money knows the game: macro noise, conviction unchanged.”
Despite temporary market jitters, IBIT’s performance underscores persistent institutional confidence. Over recent weeks, it has frequently led daily ETF inflow rankings and now approaches the $100 billion asset mark, positioning itself as one of the fastest-growing ETFs in financial history. The broader Bitcoin ETF complex collectively logged $2.7 billion in weekly inflows, despite intensified macroeconomic headwinds.
Bitcoin Price Plunge Mirrors Investor Panic
Bitcoin fell sharply to $112,324.06, representing a 7.87% daily loss, according to CoinMarketCap. The correction wiped out nearly $200 billion from Bitcoin’s market value, leaving its capitalization at $2.23 trillion, while its fully diluted valuation stood at $2.35 trillion. Trading volume increased dramatically, rising 188.93% to $201.60 billion, primarily due to panic-selling activity on the exchanges. The value of the token fell to around $121,500 and later rose above $112,000.
Related: Bitcoin Crashes 17% As Crypto Market Loses $19 Billion
IBIT Stock Tracks Bitcoin’s Downturn
Data from Google Finance showed that IBIT declined 3.70%, closing at $66.20 after losing $2.54 in a single session. In after-hours trading, it slid further to $64.14, marking another 3.11% drop. The ETF traded within a $65.80–$69.66 range, mirroring Bitcoin’s broader weakness.
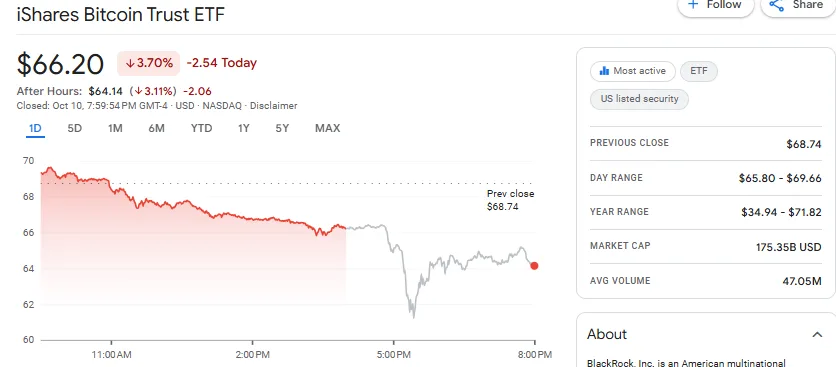
The market cap of IBIT was $175.35 billion, with a daily average volume of 47.05 million shares, indicating heavy institutional engagement. Its price fluctuation between $34.94 and $71.82 for the year points to its rapid growth.
The short-term weakness is in line with Bitcoin’s retreat, but the ongoing inflows are a sign of the institution’s confidence. The key question remains: Will retail traders’ exit from the market allow Bitcoin ETFs to continue attracting capital?
As ETF inflows persist amid rising volatility, Bitcoin ETFs, particularly IBIT, are emerging as stabilizing instruments in an otherwise turbulent market. The data suggest that institutional confidence remains strong, even when overall market sentiment appears uncertain.