
Egrag Crypto, a discerning analyst in the crypto sphere, has recently brought attention to the current challenges Bitcoin faces regarding its market supremacy. The chart provided underpins the analysis with historical examples, showcasing the tough resistance Bitcoin is up against.
A particular area of interest is the prediction shown by both the blue and green arrows, which align with an anticipated target. Interestingly, the scenario hinted at by the green arrow could herald a significant rally for altcoins.
Historical patterns provide a timeframe for these developments, which is likely to unfold within a 6 to 12-month window. This insight into Bitcoin’s dominance trajectory offers a compelling forecast for the interplay between the pioneering cryptocurrency and its alternative counterparts.
Egrag, a recognized cryptocurrency analyst, has put forward a thought- analysis on the trajectory of Bitcoin leading up to its next halving event. Highlighting a critical juncture, Egrag points to the necessity of a pullback to the $48,000 level as a foundational step for Bitcoin’s valuation to skyrocket to the $200,000 mark. This projection comes with the halving event looming, an occurrence traditionally associated with substantial price fluctuations.
Egrag’s insights suggest that a decline of around 36% in Bitcoin’s price is expected and is a historical norm just before halving events take place. Despite the possible discontent, this prediction might spark a retracement among the crypto community, and it is deemed essential to set the stage for a stronger rally. Furthermore, the analysis indicates that this drop could be the catalyst for the initial wave of the altcoin season, an event eagerly anticipated by investors.
Bitcoin has experienced a slight dip in value, with a 1.68% decrease over the last 24 hours, bringing its price to $66,284. This fluctuation follows a trend illustrated in the one-day chart, showing volatility within the market. Despite this minor downturn, Bitcoin maintains a robust market capitalization at $1.3 trillion, still holding the number one rank in market cap among cryptocurrencies.
The trading volume has surged by 30.42% to $40.67 billion in the same period, indicating a high level of trader activity, which could be in response to the price movement. The volume-to-market cap ratio is 3.12%, suggesting a liquidity level that is considerable for the size of Bitcoin’s market.
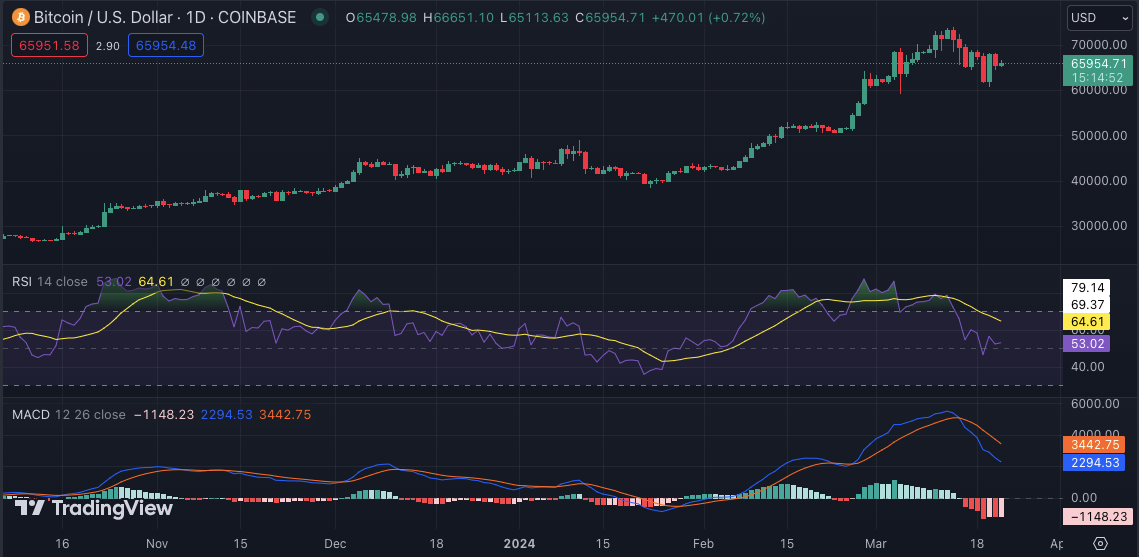
Technical indicators on the daily chart are showing mixed signals. The Relative Strength Index (RSI) is at 53.49, which is near the middle of the neutral zone, indicating that Bitcoin is neither overbought nor oversold at this level. Meanwhile, the Moving Average Convergence Divergence (MACD) has crossed into negative territory, with the histogram bars turning red and indicating a bearish momentum as the MACD line has crossed below the signal line.