USDT's trading volume on centralized exchanges (CEXs) rises with crypto price surge, albeit below previous peaks.
Despite modest trade volumes, USDT's market cap hits record highs, prompting inquiries into underlying dynamics.
Technical indicators suggest potential downtrend for USDT, cautioning traders to await confirmation before significant decisions.
- USDT’s trading volume on centralized exchanges (CEXs) rises with crypto price surge, albeit below previous peaks.
- Despite modest trade volumes, USDT’s market cap hits record highs, prompting inquiries into underlying dynamics.
- Technical indicators suggest potential downtrend for USDT, cautioning traders to await confirmation before significant decisions.
According to data from Kaiko, a research platform, the trading volume of Tether’s USDT on centralized exchanges (CEXs) has risen alongside the recent upswing in cryptocurrency prices. Nonetheless, despite this uptick, the volumes remain significantly lower than the peak of $661 billion observed in May 2021.
Interestingly, they are currently at levels akin to those seen in the previous bull market. This raises an important inquiry regarding USDT market capitalization hitting record highs despite relatively modest trade volumes.
Moreover, the current Tether price stands at $1.00, with a 24-hour trading volume of $104,078,879,417. This signifies a marginal increase of 0.04% over the last 24 hours, with a current market cap of $102,479,458,393. Despite a circulating supply of 102,434,373,085 USDT coins, the maximum supply remains undisclosed, adding an element of uncertainty to the market dynamics.
Moreover, insights from technical indicators shed light on the current state of the USDT market. The Relative Strength Index (RSI) on the daily price chart indicates a reading of 46.86, suggesting a potential downtrend but not yet reaching oversold territory. Traders are advised to keep a close watch for potential buying opportunities as the RSI approaches oversold levels.
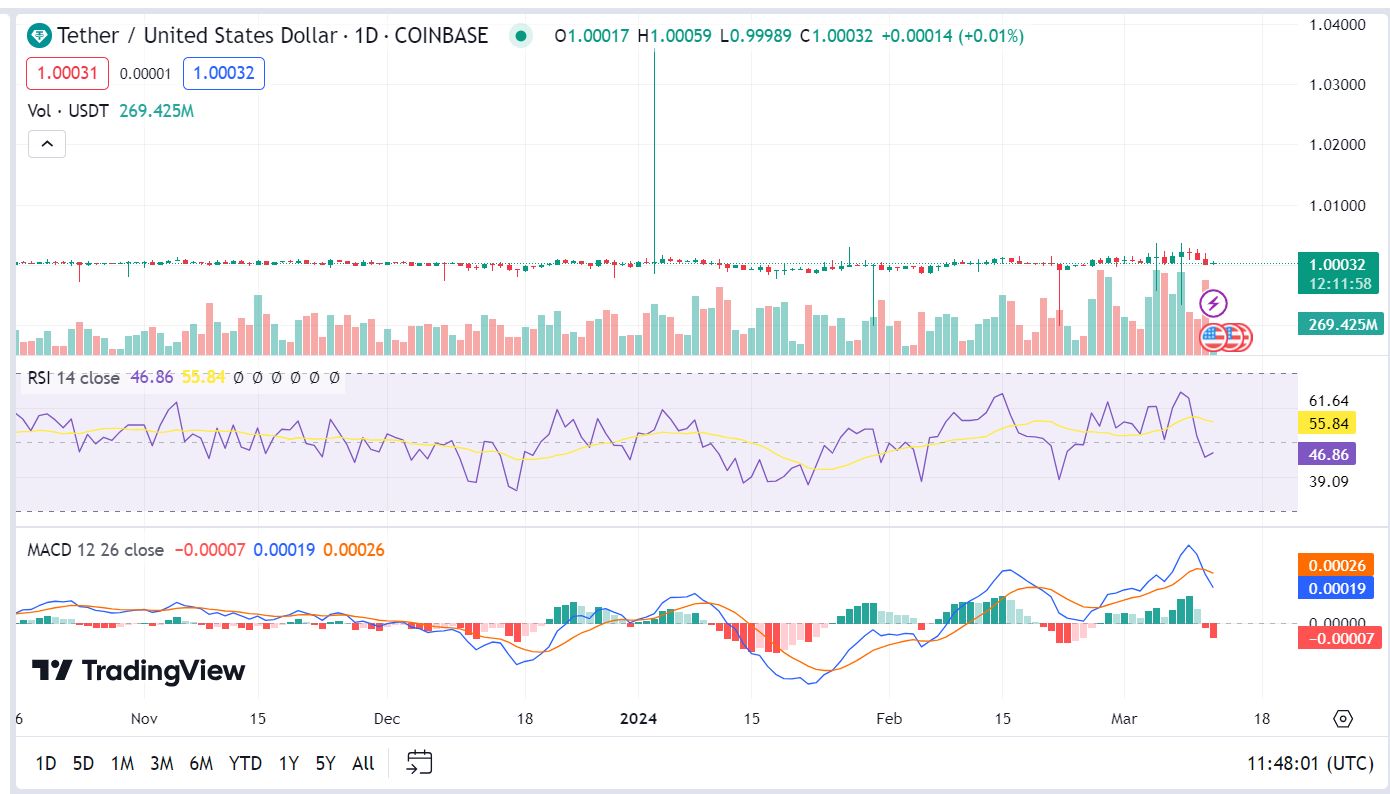
Additionally, the Moving Average Convergence Divergence (MACD) stands at 0.00019, indicating some positive momentum in the market. However, traders are cautioned to exercise prudence and await confirmation of a trend reversal before making significant trading decisions. These technical indicators provide valuable insights for investors navigating the volatile cryptocurrency landscape.
However, despite the positive momentum indicated by technical indicators, the discrepancy between trade volume and market capitalization remains a puzzle. It prompts further investigation into the factors driving USDT’s market cap to unprecedented heights amidst relatively modest trade volumes on CEXs.
While USDT trade volume experiences a surge on centralized exchanges, its market capitalization reaches new peaks. This discrepancy raises questions about the underlying dynamics at play within the cryptocurrency market. Both traders and analysts are closely observing these developments, striving to unravel the mystery surrounding the surge in USDT’s market capitalization despite moderate trade volumes.