- VeChain’s “White Retest” could mark a pivotal moment, potentially driving the coin to new highs.
- Despite optimistic chart projections, current market conditions suggest caution with VeChain’s bearish trend.
- Technical indicators highlight oversold conditions and bearish momentum, urging traders to exercise vigilance.
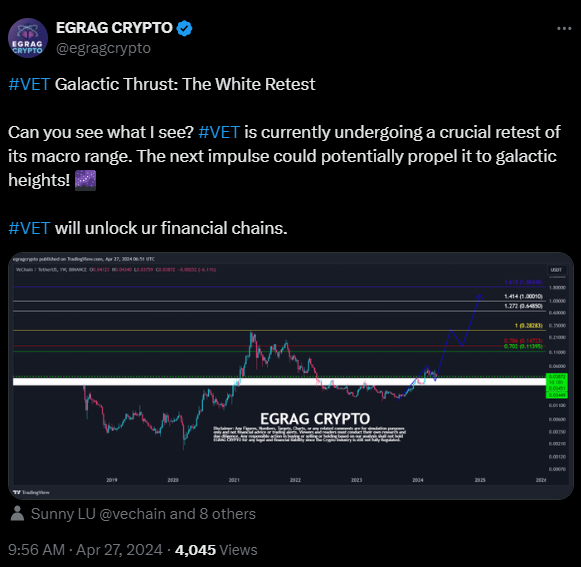
VeChain (VET) enthusiasts are eagerly eyeing a pivotal moment in the coin’s trajectory dubbed “The White Retest,” heralding a potential surge to celestial heights as per analyst Egrag Crypto. Analyzing the price trends and technical indicators, investors are speculating on whether VeChain is poised for a bullish breakout after a period of consolidation.
The journey of VeChain’s price has been a rollercoaster ride. It was characterized by bullish momentum from 2019 to late 2021, followed by a descent into a bearish trend with lower highs and lower lows. However, since 2022, VeChain has been consolidating within a narrowing range, hinting at a possible accumulation phase.
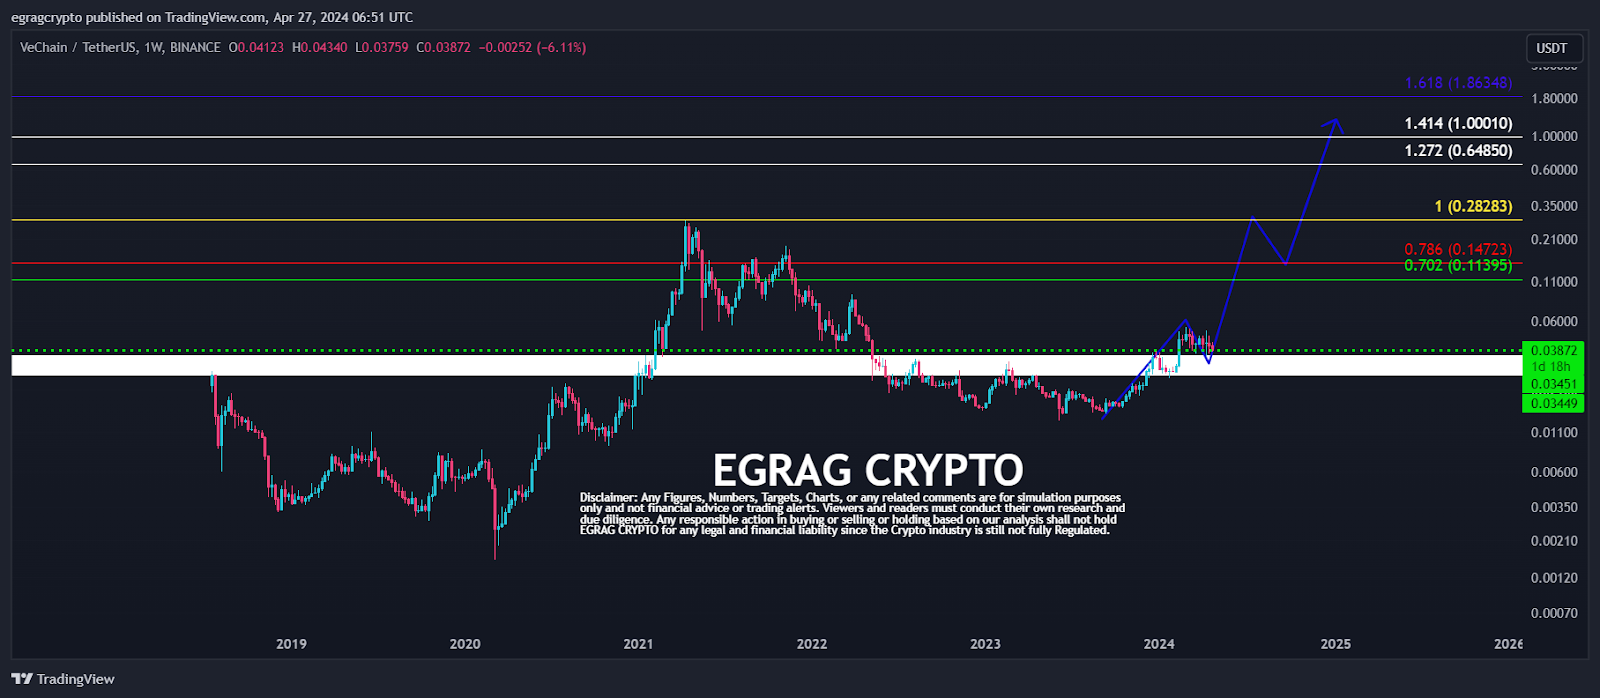
Key support levels, such as the $0.03 mark and Fibonacci retracement levels at 0.786 and 0.702, underscore crucial areas where buyers historically entered the market. Conversely, resistance levels, including those at $0.28283 and Fibonacci extension levels like 1.272, 1.414, and 1.618, pose significant barriers to upward movement, reflecting areas of historical selling pressure.
Chart projections outline an optimistic scenario, depicting VeChain’s potential ascent towards Fibonacci extension levels. However, current market conditions indicate a different story. With VeChain trading at $0.038467 and a 24-hour volume of $53,529,481, the coin has experienced a 2.08% decline in the last day.
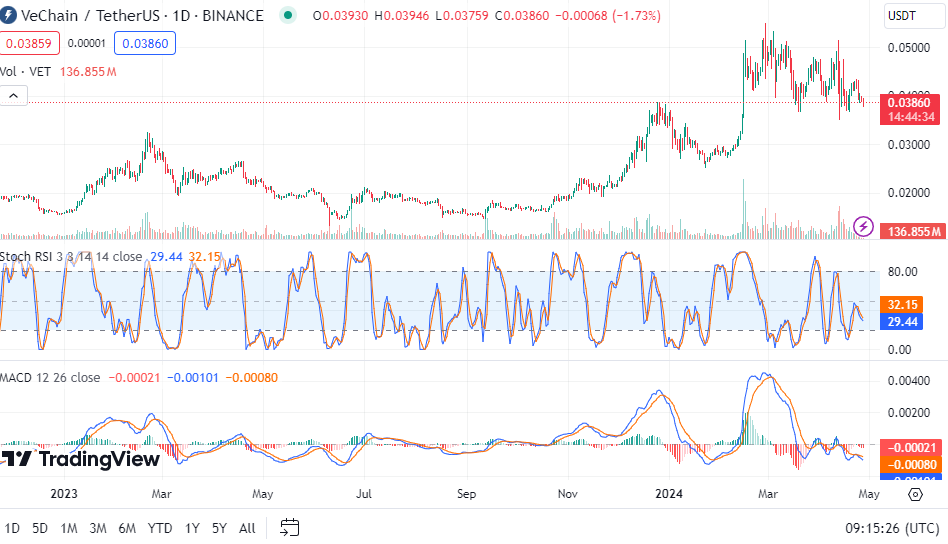
Technical indicators provide further insight into VeChain’s current state. The 1-Day Stochastic RSI signals oversold conditions, potentially signaling a buying opportunity for traders anticipating a rebound. However, caution is warranted as the 1-Day 50 EMA, 100 EMA, and 200 EMA all point to a bearish trend, with the 50 EMA positioned below both the 100 EMA and 200 EMA.
Moreover, the 1-Day MACD confirms a bearish momentum, reinforcing the likelihood of a downtrend. Traders are advised to monitor the MACD line closely for a potential crossover above the signal line, which could serve as a signal to consider long positions.