
Solana (SOL)has been on a rollercoaster regarding price action lately. As highlighted by Altcoin Sherpa, an analyst, with its recent surge, investors are eyeing even higher peaks, projecting a potential rise to $500 or more by the end of the year.
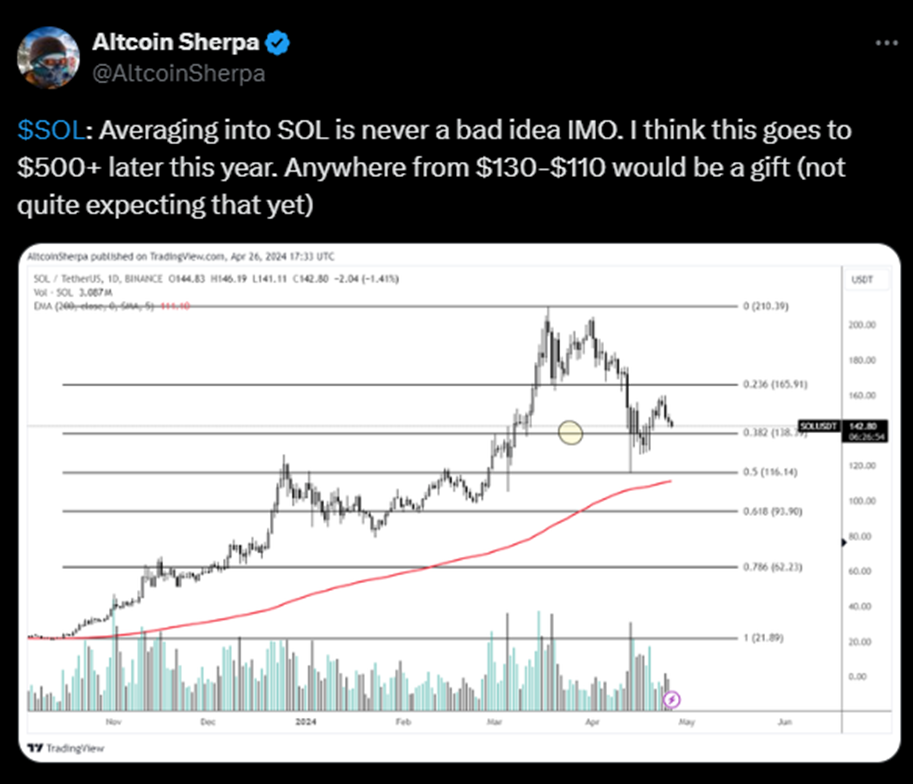
The latest data reveals SOL trading at $135.88, marking a slight decline of 5.83% within the past 24 hours. Despite this dip, the cryptocurrency is showing signs of resilience, with its 1-Day RSI hovering around 38.48, indicating nearing oversold conditions. Such a scenario often prompts traders to consider it a potential buying opportunity, anticipating a rebound in price.
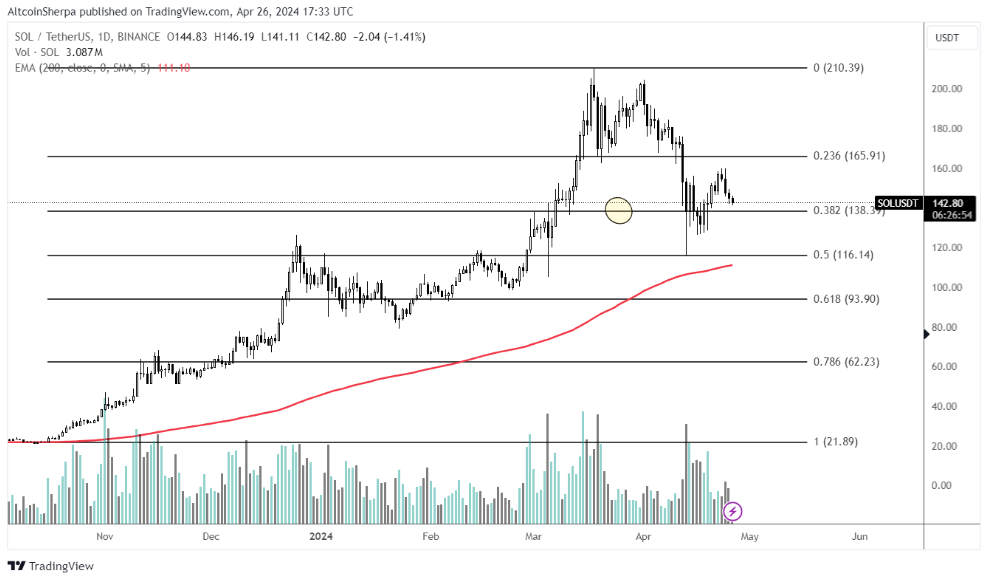
On the technical side, SOL’s price trend since November has exhibited a notable uptrend, characterized by higher lows and higher highs, indicative of a bullish market sentiment. The ascending 200-day exponential moving average (EMA) further reinforces this bullish outlook, with the price consistently staying above this long-term indicator, a positive sign for sustained upward momentum.
Delving into support and resistance levels, the Fibonacci retracement levels provide valuable insights. The 0.382 level, situated around $138.37, has emerged as immediate support, witnessing a rebound in price as indicated by candlestick patterns. Should the price retreat further, the 0.5 level at approximately $116.14 could serve as the next support zone, followed by the 0.618 level around $93.90, offering a more robust support base in case of a deeper retracement.
Analyzing trading volume adds another dimension to the market assessment. Observing increased volume during price declines suggests significant trading activity, potentially signaling periods of accumulation or distribution.
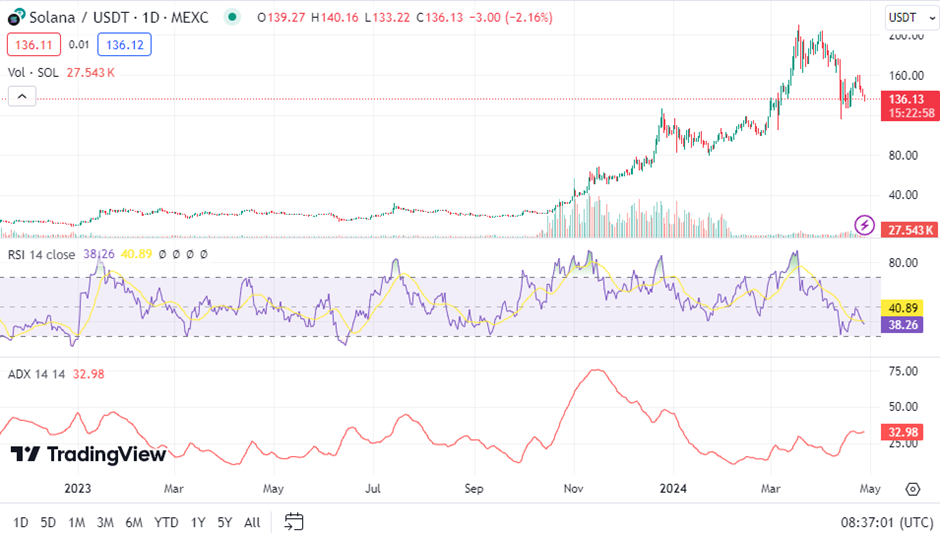
However, despite the bullish indicators, caution is warranted, particularly with the 1-Day MACD trading below the signal line, indicating short-term bearish momentum. Moreover, the 1-Day ADX reading of 32.98 underscores a strong trend, suggesting that the current bearish momentum might persist.