
WBTC price approaches a key support area of around $17,000 amid market volatility post key central bank’s rate decisions
- Wrapped Bitcoin (WBTC) edges lower on Thursday following two days of gains.
- The bulls failed to sustain the gains above $18,500 that occurred in the previous sessions.
- A daily candlestick above $18,00 would invalidate the bearish outlook.
Wrapped Bitcoin Price (WBTC) analysis shows a mildly bearish outlook for the day. The price tested the high of $17,999.70 but retreated as the U.S. session has begun. The Dow Jones lost more than 400 points, while the S&P 500 and Nasdaq fell 2.16% and 2.40% respectively. Investors avoid the riskier assets amid the fear of the looming global recession and hawkish central banks.
Wrapped Bitcoin is trading at around $17,500 with a 24-hour market cap of $3,482,450,657. The trading volume gained more than 100% to $139,301,702.
Alameda Research attempted to retrieve 3K WBTC days before FTX’s bankruptcy filed on November 11 as reported by Mike Belshe, the CEO of digital asset custodian BitGo. However, the request was declined due to a lack of security validation.
WBTC price seeks bearish validation
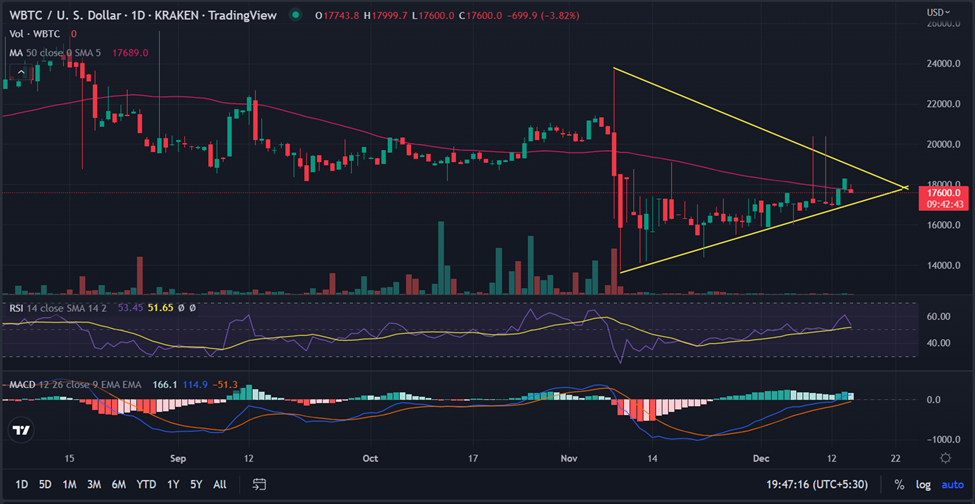
On the daily chart, the Wrapped Bitcoin price analysis signals the continuation of the downside movement. To do so, the WTC bears must accumulate strength to breach the “ Symmetrical Triangle” formation. That connects two divergent lines from the low of $13,729 and the high of $23,672.1.
As the WTC hovers below the 50-day EMA, the probability looks in the favor of the sellers. In that case, the price could test the ascending trend line around $16,990.
Further, the next downside target could be found around the low of December 6 at $16,000.
On the other hand, a close above the session’s high could defy the negative sentiment around the token. Additional buying participation would be required to surpass the immediate upside hurdle at $18,250.
On moving higher, the bulls would attempt to test the horizontal resistance at $19,250.
Technical indicators:
RSI: The daily RSI (14) tests the average line but manages to stay above. This indicates a sideways movement in the short term. Any downtick in the indicator could dampen the sentiment.
MACD: The momentum oscillator holds above the central line but declining bullish momentum.
Conclusion: With mixed indicators, traders are advised to wait before placing aggressive bids. A clear breakout of the range would set the next directions bias.