Bitcoin’s recent price movements and market dynamics reveal intriguing insights into the current sentiment among traders and investors. Despite consolidating for over six weeks within a certain range, the cryptocurrency attracts attention from both large and retail investors.
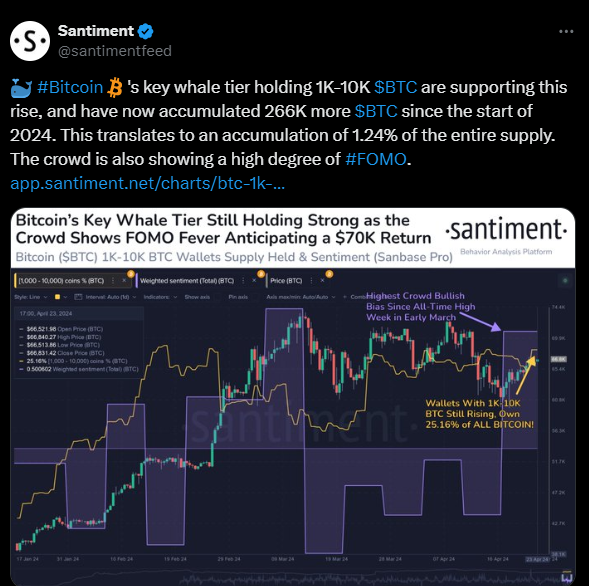
As highlighted by Santiment, an analytic firm, the key whale tier, comprising entities holding between 1,000 to 10,000 BTC, has notably accumulated more Bitcoin since the beginning of 2024. This accumulation amounts to 266,000 additional BTC, representing around 1.24% of the total Bitcoin supply.
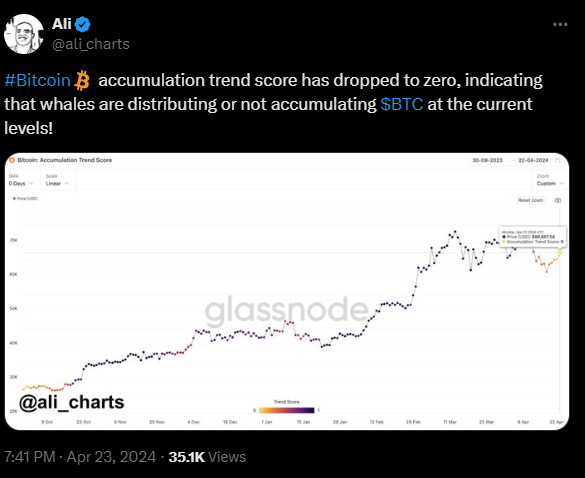
The behavior of these major holders suggests a bullish sentiment as they continue to build their positions. However, alongside this accumulation, there are signs of caution and uncertainty in the market. As per Ali Martinez, a top analyst, the Bitcoin accumulation trend score has dropped to zero, indicating that whales might be distributing or refraining from further accumulation at current price levels.
Another notable aspect is the sentiment among retail investors, as evidenced by the high Fear of Missing Out (FOMO) observed in the crowd. This FOMO often correlates with periods of increased market volatility and can influence short-term price movements.
Despite the apparent boredom in the market, with Bitcoin seemingly range-bound below $60,000, many perceive this as a significant buying opportunity. The current price of Bitcoin stands at $66,691.81, showing a modest 0.39% increase over the last 24 hours. The Relative Strength Index (RSI) for Bitcoin on the daily chart indicates a neutral trading zone, suggesting potential for both upward and downward price movements.
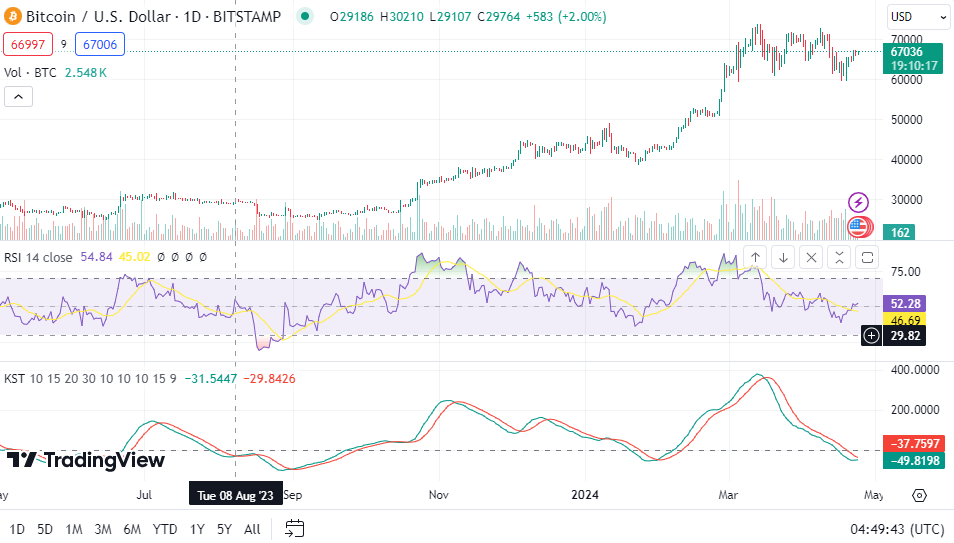
Bitcoin/USD 1-Day price chart, Source: Trading view
Analyzing the technical indicators, the Moving Average Convergence Divergence (MACD) is bullish in the short term, with the MACD line trading above the signal line. This typically signals positive momentum. However, the Know Sure Thing (KST) indicator hovers around the zero line, reflecting Bitcoin’s price direction indecision.