Why Bitcoin’s 2026 Cycle Bottom Slipped Below $80K

- Bitcoin slipped under $80K as policy shifts and thinning liquidity strained market resilience.
- Spot ETFs saw $1.61B in January outflows, weakening demand during Bitcoin’s decline.
- Prediction markets gave a 63% chance of Bitcoin testing the $69K level in early 2026.
Bitcoin’s price slump in early 2026 cut through expectations with surprising speed, slipping beneath the psychological $80,000 support level that many traders had treated as a dependable floor. The level mattered less for its numerical precision and more because it captured a broader shift in sentiment.
However, what unfolded resembled a mid-cycle drawdown, though a sharper one, shaped by tightening macro conditions, heavy liquidations, and a noticeable retreat from risk across desks that had previously leaned into the rally.
A Break of Key Support Amid Market Turmoil
Through late January and early February, Bitcoin unwound much of its late-2025 strength. The asset had peaked above $126,000 months earlier, only to surrender major price zones as the new year progressed. On January 31, the token briefly touched about $75,787, marking a drawdown of more than 22% from its January high near $97K.
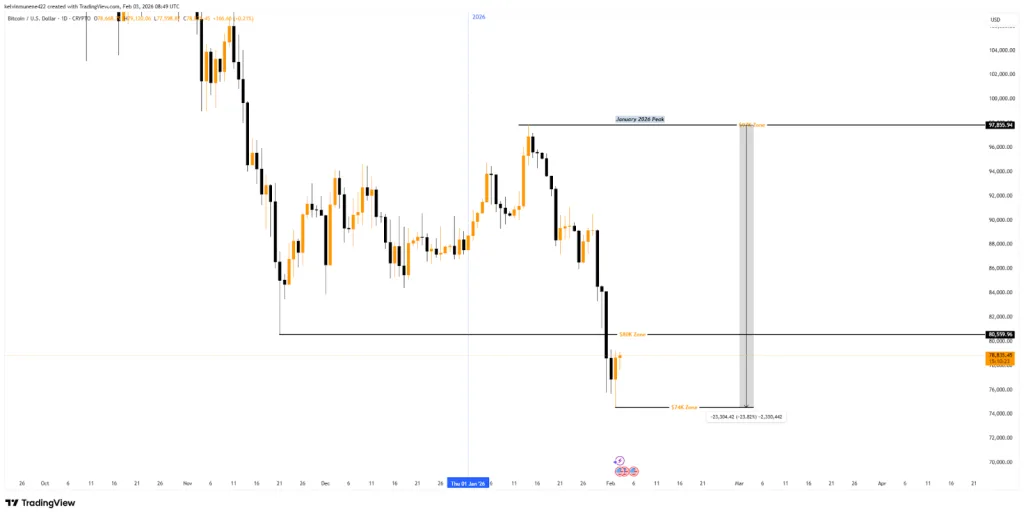
Source: TradingView
These cracks emerged from changing expectations around U.S. monetary policy. Around that same period, confirmation that former Federal Reserve governor Kevin Warsh would become the next Fed Chair altered market assumptions. Investors began pricing in a firmer policy stance, reduced liquidity, and higher funding costs across risk assets.
According to Reuters, traders interpreted the shift as a signal that the era of abundant capital was ending. Notably, assets that had benefited most from loose financial conditions reacted first. Moreover, as yields on U.S. Treasuries rose, capital rotated toward safer instruments, weakening demand for speculative exposure.
Liquidations Turned Decline Into a Cascade
Once prices entered the $80,000 zone, leverage amplified the downside. Large volumes of long positions were forced closed as margin thresholds were breached. Market reports acknowledged more than $2.5 billion in leveraged positions liquidated during the sell-offs, one of the largest liquidation waves in months.
In derivatives-heavy markets, forced selling feeds on itself. Each liquidation pushes prices lower, triggering further margin calls. This feedback loop accelerated the slide and erased bids that might otherwise have slowed the fall. The result was a swift move through levels that had been held earlier in the cycle.
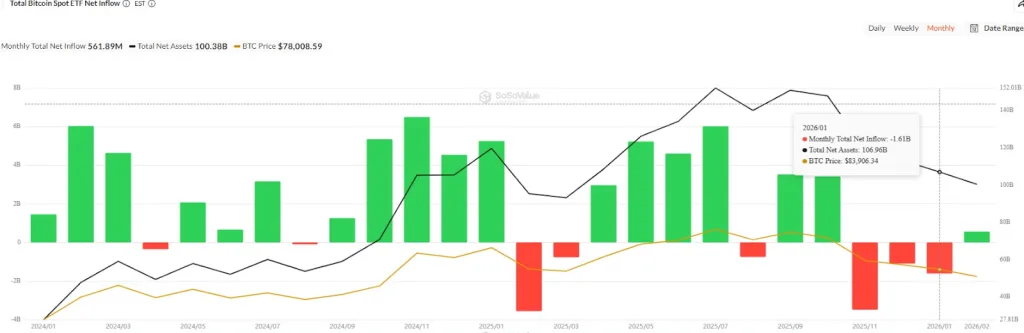
Source: SoSoValue
Institutional flows added to the pressure. Spot exchange-traded funds, which had absorbed significant capital during prior rallies, saw sustained outflows. Data compiled by SoSoValue showed net January outflows of about $1.61 billion, removing a key source of structural demand.
Sentiment and Liquidity Deepened the Move
As prices fell, sentiment followed. Prediction markets began assigning higher odds to further downside. On the Myriad platform, traders priced a 66% probability that prices could test the $69,000 area, reflecting a clear turn toward caution rather than optimism.
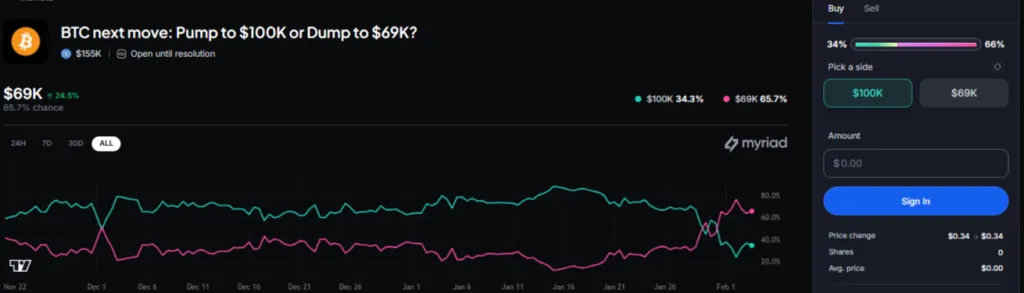
Source: Myriad
Thin liquidity conditions, especially during low-volume weekend trading, also exacerbated price moves. In illiquid conditions, even modest sell orders can have outsized effects on price, pushing Bitcoin briefly below the emotional $80,000 mark before small rebounds.
Macro Headwinds: Policy and Global Risk
Investors also cited broader economic concerns, beyond crypto-specific issues. Rising U.S. Treasury yields, fears of tighter monetary policy, and geopolitical tensions combined to shift investors out of risk-oriented assets. Bitcoin, often treated as a high-beta speculative asset, was among the first to feel the pressure when risk aversion spiked.
This shift in appetite wasn’t limited to crypto: equities, commodities, and other speculative markets experienced increased volatility, underscoring how closely interconnected risk assets have become. For many institutional investors, Bitcoin’s retreat below key levels triggered rebalancing, allocating capital to safer treasury bonds and traditional instruments.
Related: Lighter (LIT) Cools Off After 14% Rally Yesterday, Traders Eye Key Support
Is $80K the True Cycle Bottom?
Despite the plunge below $80,000, some analysts caution against interpreting this as the definitive cycle bottom. Many technical indicators and support levels remain lower, with possible areas of interest near $70,000 and below if bearish pressure persists. But others note that extreme fear often precedes market troughs, which could make current levels attractive to long-term holders.In short, Bitcoin’s slip below $80,000 in 2026 is the product of tightening macro conditions, forced leveraged liquidations, weakening demand from institutional vehicles, and subdued risk sentiment. Whether this decline marks the cycle bottom or a temporary setback will depend on liquidity flows, investor confidence, and the broader economic backdrop in the months ahead.