Will Bitcoin’s $87K Rebound Ignite a Fierce Market Shift?

- Bitcoin shows a heavy long buildup with rising pressure near the $88,000 region.
- Short pools remain near $88,570 with strong clusters waiting to be tested soon.
- Price action stays close to support, and charts reveal rising risk across all levels.
Bitcoin moved back to the $87,000 zone over the weekend after a sharp slide earlier in the week, setting the stage for a potentially volatile stretch as new liquidation data reveals rising leverage pressure across major exchanges. The move lifted price just above key technical levels, while several charts show concentrated liquidation pools, increasing long exposure, and short clusters that could trigger abrupt shifts.
Descending Structure Points to Compressed Market Conditions
Bitcoin reclaimed $87,049 after tapping a major support block between $84,000 and $80,685. The wider structure shows that bears continue to defend the major Fibonacci zones, preventing any move toward the 0.236 level at $89,114.
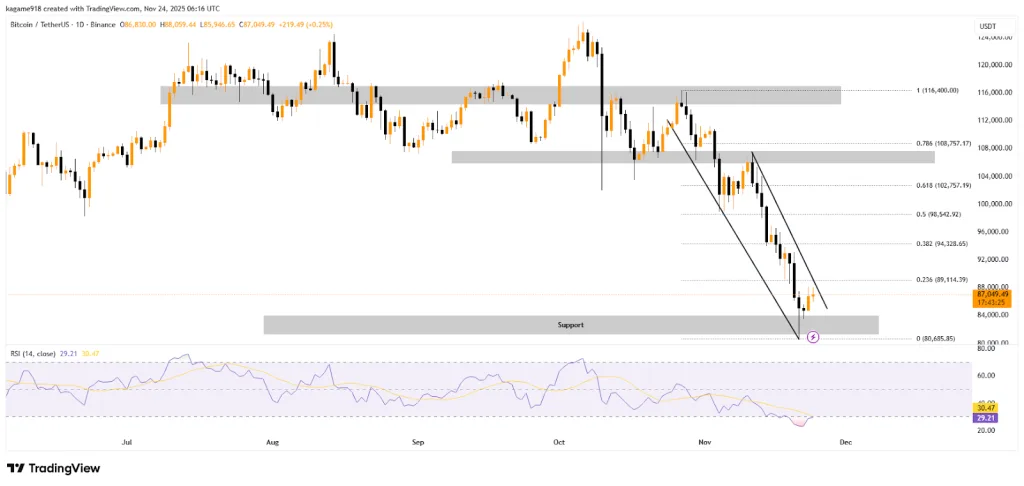
The descending channel is still firmly in play, with lower peaks forming near the 0.618 Fib at $102,757, the 0.5 Fib at $98,542, and the 0.382 Fib at $94,328. The chart also depicts supply blocks at $112,000 and $108,000, thus creating extra hurdles.
Price action continues to move near the channel boundary, which forms the structural pivot for near-term direction. If momentum builds, the $92,000–$94,328 range becomes the first retest level before any attempt toward the 0.5 Fib.
Meanwhile, the RSI at 29.21 shows oversold conditions. The upward drift suggests early divergence that often precedes corrective rallies. Traders now monitor whether bulls can build enough strength to maintain the support region labeled “Support,” which marks the $84,000–$80,685 floor.
Liquidation Maps Reveal Heavy Short Exposure and Squeeze Risk
Analyst CryptoPatel shared a 30-day Bitcoin Exchange Liquidation Map showing heavy liquidation stacks across the chart. Bitcoin traded at $86,781 at the time of the snapshot. The chart indicates cumulative short liquidation leverage accelerating toward $6.7 billion, while cumulative long liquidation leverage sits near $155.25 million.
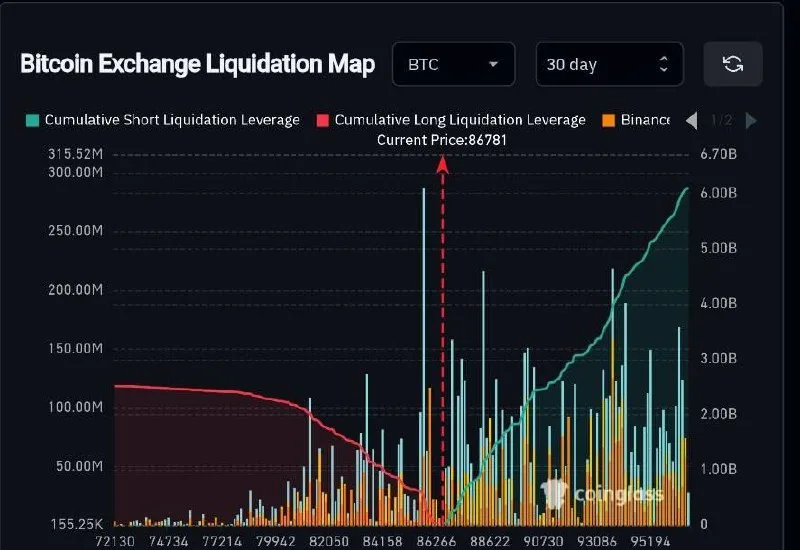
The map presents the areas of dense liquidation between $82,500 and $95,000, while the most powerful pressure zones are located between $88,000 and $90,000. The green line that follows short pressure goes up steeply beyond $6B, whereas the red line representing long pressure goes down to around $120.
Binance liquidation bars between $84,000 and $89,000 show where forced exits have concentrated. CryptoPatel also reported that a 15% Bitcoin jump could liquidate more than $8.5 billion in short positions. Such a move would create strong squeeze-fuel conditions.
Related: CryptoQuant CEO Says BTC and ETH Price Drop as Fundamentals Grow
Three-Day Heatmap Shows Long Build-Up and Short Pool at $88,570
A separate three-day aggregated liquidation heatmap, shared by analyst Joao Wedson, shows rising long exposure and significant short positions stored near $88,570. The heatmap covers the $70,000–$105,000 range, with color intensity up to $1 billion marking the largest liquidation zones.
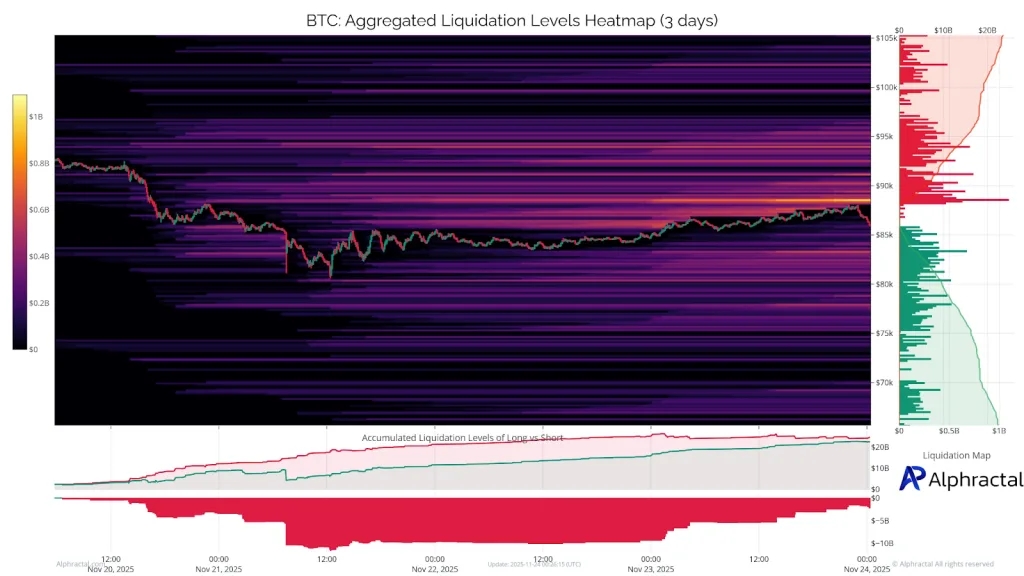
BTC’s price path moves from regions near $0.8B liquidation density to areas around $0.4B before stabilizing ahead of November 24. The right-side liquidation histogram shows long exposure exceeding $20 billion, while short exposure sits near $1 billion.
Wedson stated that bears were liquidated earlier in the period, yet long positions continued to increase. He also noted an unliquidated short pool at $88,570, which may influence price behavior as liquidity pulls Bitcoin toward clustered levels. He added that traders should expect a volatile start to the week as liquidation pressures converge near the current price band.