Story (IP) Hits $14.92 Amid Rally, Overbought Signals Emerge

- Story IP rallied 65% in a week to reach $14.92, marking a new record high for the token.
- RSI of 82.45 and Bollinger Bands confirm IP’s market is trading in overbought territory.
- On-chain data signals profit-taking and leverage risks that could pressure momentum.
Story’s native token, IP, has recorded a fresh all-time high, reaching $14.92 after a sharp rally in recent days. The surge reflects an approximate 65% increase in the last seven days, up from a low of $9.01. At present, the token’s market capitalization stands at $4.31 billion, marking a 12.71% rise, while daily trading volume has climbed to $565.96 million, a nearly 98.04% jump. Adding to the excitement, Story announced that one of Korea’s largest music catalogs is joining its platform.
According to an official X post, notable trot singer Ahn Sung-hoon will be featured alongside global icons such as Justin Bieber, BTS, and BLACKPINK. With $100 million in tokenized Korean music from Contents Technologies, Aria Protocol’s IP TVL is set to top $110 million, marking a major step for the ecosystem.
Yet, signs of exhaustion are beginning to appear. After touching its peak, IP has slipped about 8% to $13.66, aligning closely with the 78.60% Fibonacci retracement level. Technical indicators also suggest overbought conditions, reinforcing the possibility of cooling momentum. This contrast raises a key question: can Story IP sustain its bullish energy, or is the market preparing for a correction?
IP Price Action: Technical Indicators Signal Overbought Market
From a technical perspective, the Relative Strength Index (RSI) is currently at 82.45, well above the 70 threshold that typically signals overbought territory. Such levels suggest the market may be primed for a period of cooling as profit-taking occurs and price momentum stabilizes.
The Bollinger Bands reinforce this view, with IP trading above the upper band. While this reflects strong bullish momentum, it also signals reduced space for continued gains without a pause or consolidation. In the event of such a pullback, the token may revisit key Fibonacci retracement levels, which mark potential corrective zones.
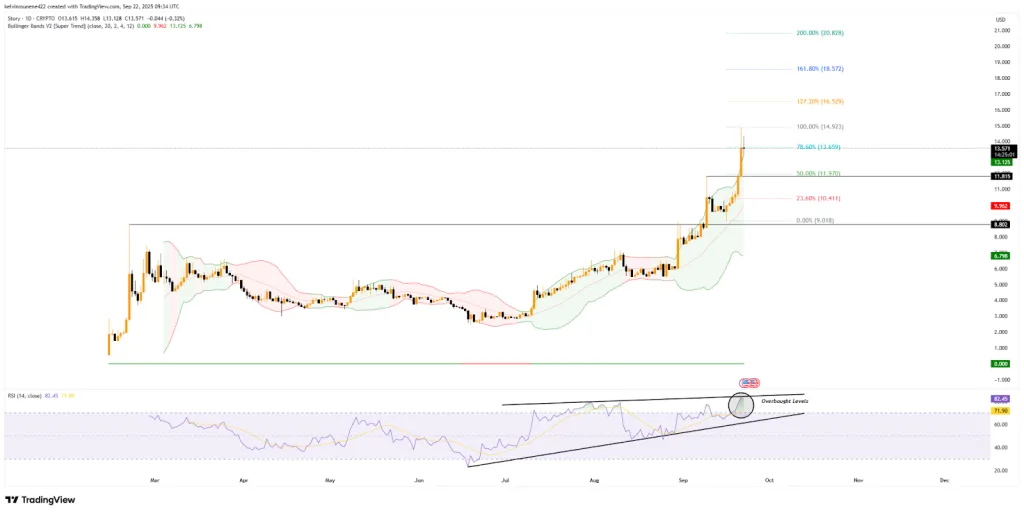
Source: TradingView
The 50% Fib mark at $11.97 stands out as a former resistance now turned support, making it a critical price to monitor if pullbacks occur. Beneath this, the $10.41 level at the 23.60% retracement aligns closely with the middle of the Bollinger Band at $9.96, creating another support cluster. In a more profound decline, the rally’s base near $9.00 could re-emerge as a floor.
On the upside, Fibonacci extensions map out potential future targets should momentum persist. The next significant point lies at the 127.20% extension of $16.52, followed by $18.57 at the 161.80% level, and finally $20.82 at the 200% extension. These projections outline the technical path for the token beyond its recent high.
Related: SPX Soars 16% as Fed Slashes Rates, What Comes Next?
Leverage Builds as Market Signals Hint at Fragile Momentum
While technical indicators continue to flag overbought conditions, on-chain data paints an equally telling picture of market stress. Liquidation charts show a surge in forced closures, with nearly $2.53 million in long positions wiped out compared to about $984,000 in shorts.
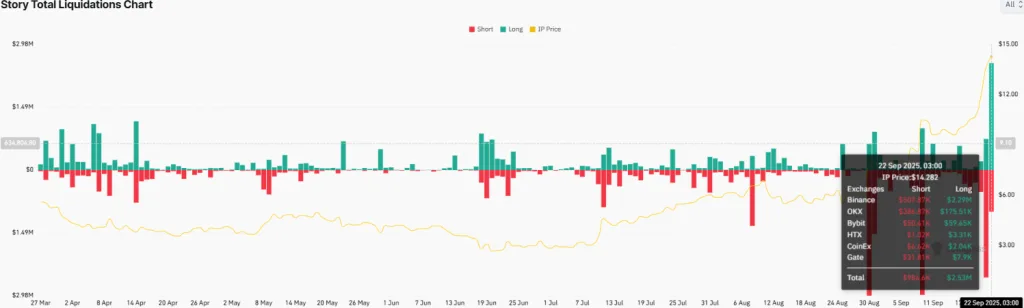
Source: CoinGlass
The imbalance underscores a market tilted heavily toward long exposure, heightening the risk of sharp corrections. The liquidation heatmap provides further clarity. At its latest reading, liquidation leverage stood at 2.58 million near $10.49, signaling considerable vulnerability should prices retreat toward these prior levels.
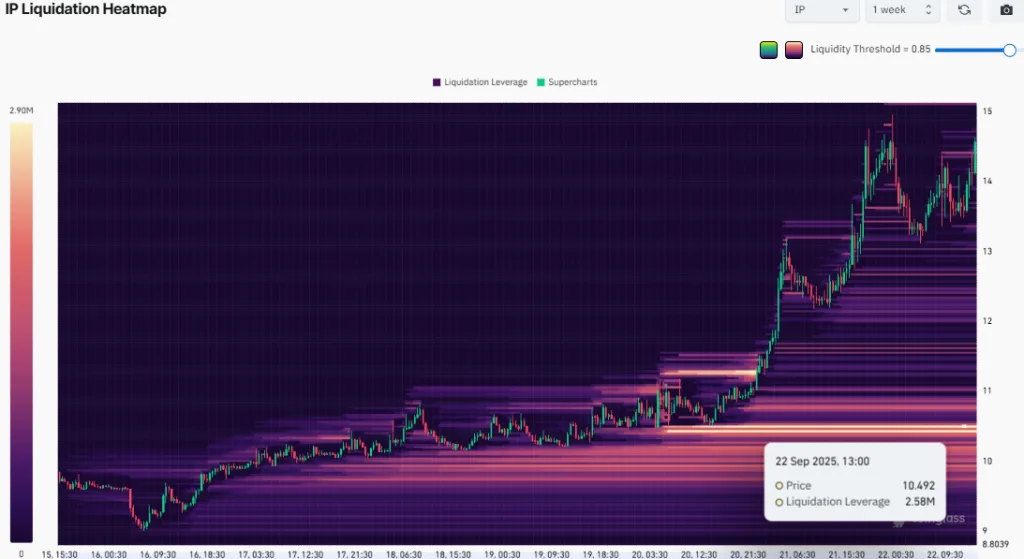
Source: CoinGlass
Such positioning creates fragile conditions where even a modest dip could cascade into broader liquidations. This zone now serves as a critical pressure point, effectively acting as a magnetic level for price movement.
Meanwhile, the exchange netflow data highlights active profit-taking. Net flows have swung deeply negative, with outflows reaching $11.70 million at press time. This trend suggests that despite strong bullish momentum, a portion of holders is cashing in on gains, tempering the broader rally.
Conclusion
Story IP’s rally to new highs underscores strong momentum and growing ecosystem adoption. However, technical and on-chain signals highlight mounting pressure from overbought conditions, clustered leverage, and active profit-taking.
While bullish sentiment remains dominant, the data suggests the market could face a cooling period or minor correction before establishing its next direction, making caution a prudent stance in the short term.