SHIB Drops 6% in a Sharp Daily Slide as Bearish Pressure Builds

- Shiba Inu drops 6% in 24 hours as selling volume climbs and long liquidations dominate.
- SHIB trades below all major MAs as the RSI slips toward oversold levels with weak demand.
- Open interest continues to fall as the $0.0000078–$0.0000075 support zone comes into view.
Shiba Inu slipped again on Monday, losing over 6% in a day, extending a four-session stretch of weakness that began late Friday. The slide came shortly after the token attempted to climb back toward the $0.00000913 region but met heavy resistance. Sellers quickly took over, triggering liquidations across derivatives markets.
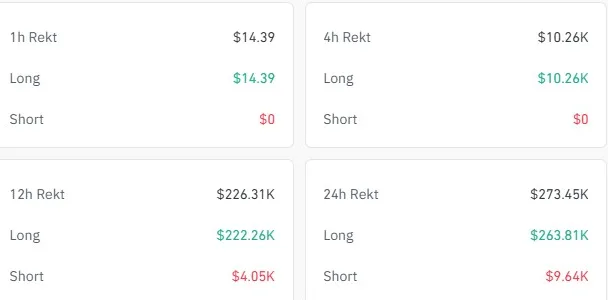
In the past 24 hours alone, more than $263k in long positions were forced out, compared with only $9.64k in short liquidations. This indicates that selling pressure is outweighing the buying spree, further reinforcing the downtrend as long position holders rush to open shorts to neutralize their exposure to further losses.
On the other hand, trading activity moved in the opposite direction. According to CoinMarketCap, SHIB’s 24-hour volume jumped more than 51%, reaching about $125 million. That kind of spike usually indicates renewed interest, but in this case, most of it leaned heavily toward distribution rather than accumulation, adding weight to the ongoing pressure.
The pattern aligns with the broader market mood, which has leaned heavily toward caution. With momentum sliding and traders on edge, attention now shifts to whether this downturn marks a passing pullback or the start of a broader deterioration.
SHIB Trades Below All Major Moving Averages
From a technical view, the trend remains firmly pointed downward. SHIB continues to sit beneath the 20-day, 50-day, 100-day, and 200-day moving averages, each positioned above the market and drifting lower.
This arrangement confirms sustained weakness and shows that buyers have not mounted any meaningful challenge across short- or long-term timeframes. Besides, price is now trading inside a descending broadening wedge, a pattern that usually signals a reversal only after a clear breakout.
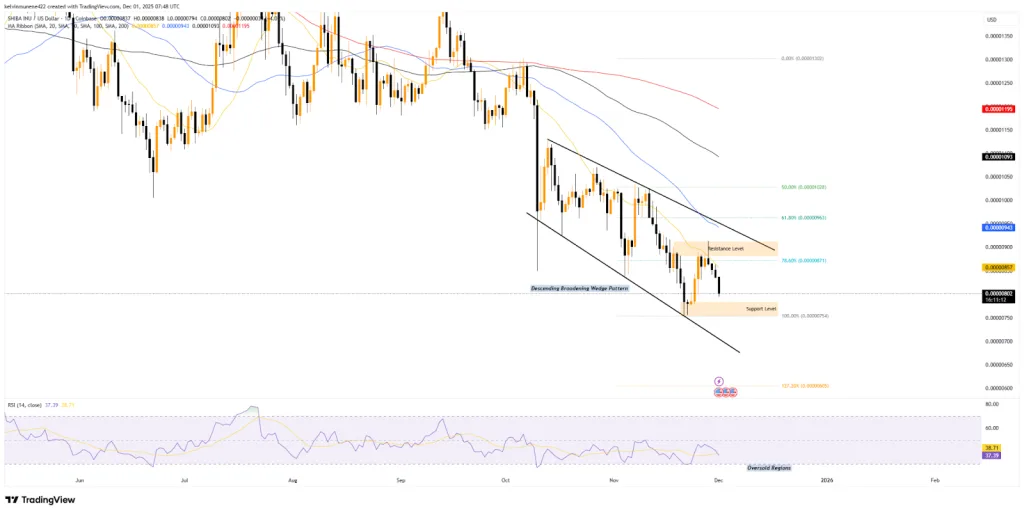
For now, the token remains trapped between the diverging trendlines as volatility widens. Should selling persist, a drop toward the lower boundary of the wedge appears likely, where price historically reacts.
Momentum indicators tell a similar story. The RSI hovers near 37, still some distance from the oversold 30 mark. This indicates that sellers continue to set the pace, and buyers have yet to demonstrate the strength needed to shift sentiment.
On-Chain Activity Shows Fading Confidence
Looking at on-chain and derivatives data, trust in SHIB is still declining. The 11% drop in open interest over the last day is a sign of fewer active positions as traders close their exposure.
A declining OI while the price drops usually means the market is dominated by those exiting rather than by those hedging or adding to their positions. Such a sentiment mainly indicates the lack of faith in SHIB’s near-term price rebound.
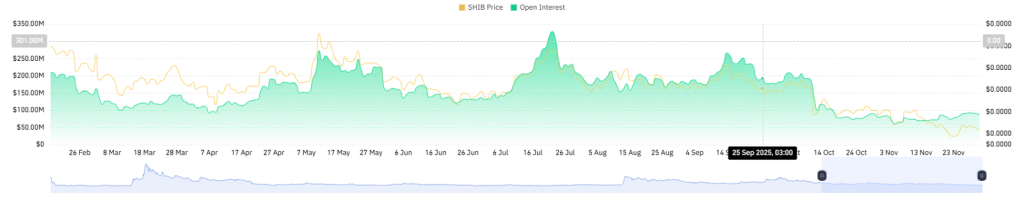
This pattern is seen across the overall derivative market, where long liquidations have exceeded short liquidations. The difference indicates that there is a lot of selling pressure, and it also strengthens the view that traders are taking a defensive position as they expect more volatility on the downside.
Related: XRP Price Rejected at Multi-Week $2.30 Highs: What’s the Next Move?
Levels That Will Define SHIB’s Next Move
The token now approaches its immediate support at $0.0000078–$0.0000075, an area that recently prevented a deeper sell-off. If buyers enter the market with conviction, this region could provide a base for a short bounce.
Nevertheless, if this band fails, the next likely destination sits near the wedge’s lower trendline. Below that, the $0.00000605 area, aligned with the 127.20% Fibonacci extension, becomes a realistic downside target.
However, for sentiment to turn, SHIB must first reclaim the 20-day moving average around $0.0000085. Regaining this level would mark the earliest sign that buyers are willing to return. A sustained move above it could bring the token back toward the $0.00000881–$0.00000913 resistance zone, which originally triggered the ongoing decline.
Clearing this zone would open the door to the 50-day moving average at $0.00000943, a level strengthened by the 61.80% Fibonacci retracement. Yet technical strength alone will not be enough; the RSI must also climb above 60 to show that buyers have regained control.