TRON Holds Long-Term Ascending Channel as Weekly Trend Stays Firm

- TRON keeps its multi-month ascending channel intact as weekly trend support holds.
- Higher lows and Fibonacci levels continue to define TRX structure across the 2024–2026 range.
- Derivatives interest rises as funding stabilizes, hinting at renewed market positioning.
TRON is holding firm on its higher-timeframe structure, even as the market cools from recent advances. The latest weekly chart shows the token trading near $0.312 with a 4.37% weekly gain, according to CoinMarketCap.
What stands out is not the move itself but the broader formation that continues to guide it. Price remains pinned inside a year-long ascending channel, one that has repeatedly caught pullbacks and steered the trend higher since late 2024.
That channel, tested several times on both sides, now acts as the backbone of the trend. Even after TRX was pushed away from the upper boundary near $0.37, the larger pattern didn’t buckle. The snapshot suggests a market still respecting its long-term map, with sellers failing to force a structural break and buyers defending familiar territory.
Ascending Channel Maintains the Broader Framework
The rising channel remains the central feature of the weekly chart. Its upper and lower boundaries have shaped price behavior for more than a year, forming a path that the market continues to follow.
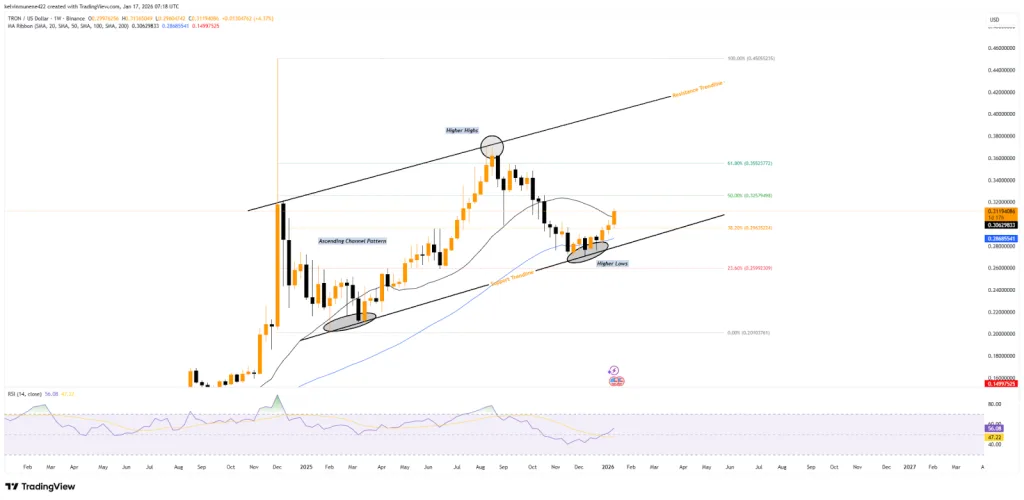
Source: TradingView
The rejection near $0.37 came almost exactly where the upper boundary meets the 61.8% retracement at around $0.355. This zone has acted as a difficult threshold in previous attempts.
What matters more for trend watchers, however, is the lower boundary, which once again held firm as price cycled down toward support. Each retreat has produced a higher low, even during stretches of broader market fatigue. That pattern, though simple, tends to carry weight in long-term analysis.
Fibonacci Levels Still Dictate the Middle Ranges
The chart’s Fibonacci layout shows three levels playing an outsized role. The 50% retracement near $0.326 remains a mid-range marker that the market has used repeatedly during both advances and pauses. Slightly lower, the 38.2% level around $0.296 provided the latest foothold, triggering a rebound just above it.
On the other hand, the 23.6% retracement near $0.260 sits almost directly along the ascending support line, adding another layer to a region that has cushioned deeper pullbacks over the past year. None of these levels carries dramatic implications on its own, but together they outline how price continues to move within familiar boundaries.
Moving Averages and RSI Show Steady Trend Conditions
The midterm moving averages give a similar read. At press time, TRX remains above the 50-week simple moving average, which continues to angle upward despite the recent cooling. The shorter ribbon is flattening, hinting at consolidation rather than any shift in direction.
Momentum readings echo that soft balance. Weekly RSI has worked its way back to roughly 56 after dipping toward the high 40s earlier in the quarter. That move nudges the indicator above the midpoint, often associated with healthier trend conditions, yet still well below any overheated range.
Related: Decred Jumps Over 60% as It Extends Lead Against Privacy Coins
Derivatives Positioning Stays Measured
Derivatives flow adds another piece to the picture. Funding rates have hovered close to neutral, landing near +0.0086% on Jan. 17 while TRX traded around $0.31. After months of drifting between modest positive and negative readings, the current balance suggests neither side is pressing aggressively.
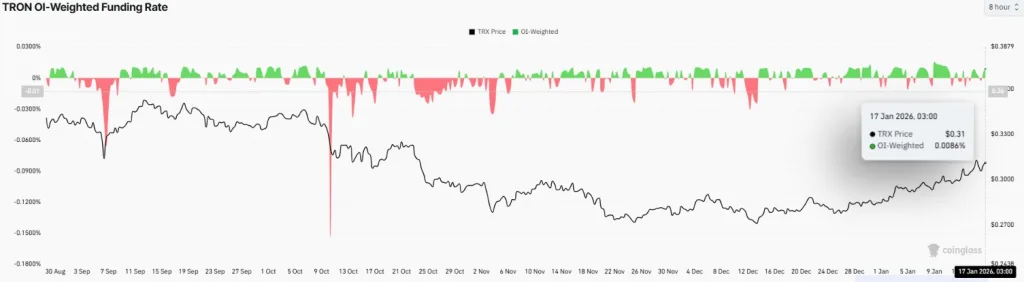
Source: CoinGlass
Open interest, however, has picked up. From a trough near $214 million in December, it climbed to about $273 million by mid-January. Rising open interest during a quiet tape often points to new positions returning after a cleanup phase. That doesn’t establish direction, but it does signal that participation is rebuilding.
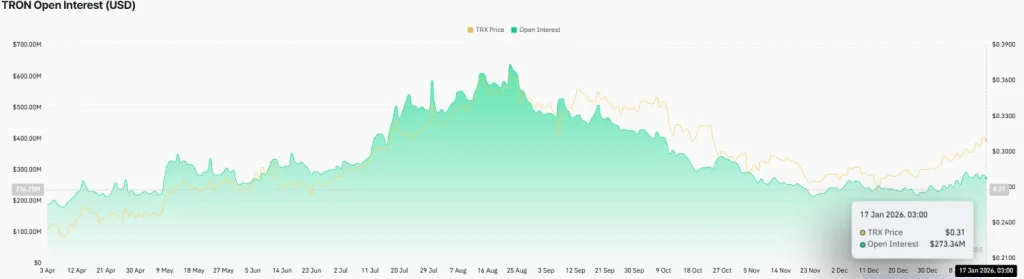
Source: CoinGlass
Overall, across spot and derivatives markets, the broader trend that has followed TRON since early 2024 remains intact. The ascending channel continues to anchor the structure, offering a clear reference point as volatility begins to re-enter the market.