
Analyzing the price action, it becomes evident that Arbitrum established a significant low back in September ’23. As highlighted by CryptoBullet, an analyst, since then, the price has been consolidating and currently appears to be at a higher low. This suggests a possible shift in momentum, signaling a favorable entry point for those inclined toward this project. The recommended buy zone for Arbitrum lies between $1.16 and $0.95, offering a strategic entry opportunity for potential investors.
At press time, Arbitrum is trading at $1.08, showing a slight decline of 1.84% over the last 24 hours. However, amidst this dip, there are clear indications that the market might be primed for a turnaround.
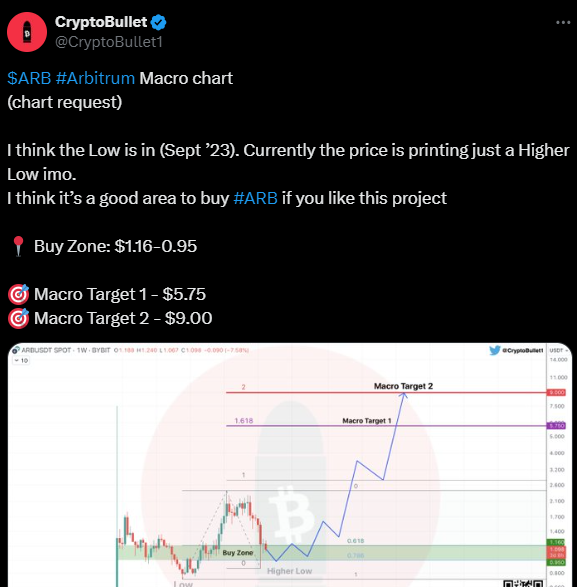
The macro targets for Arbitrum paint an optimistic picture, with the first target standing at $5.75. This represents a substantial upside potential from the current price levels. Furthermore, the second macro target is set at $9.00, indicating even greater room for growth. These targets highlight the bullish sentiment surrounding Arbitrum and underscore its potential as an investment opportunity in the cryptocurrency space.
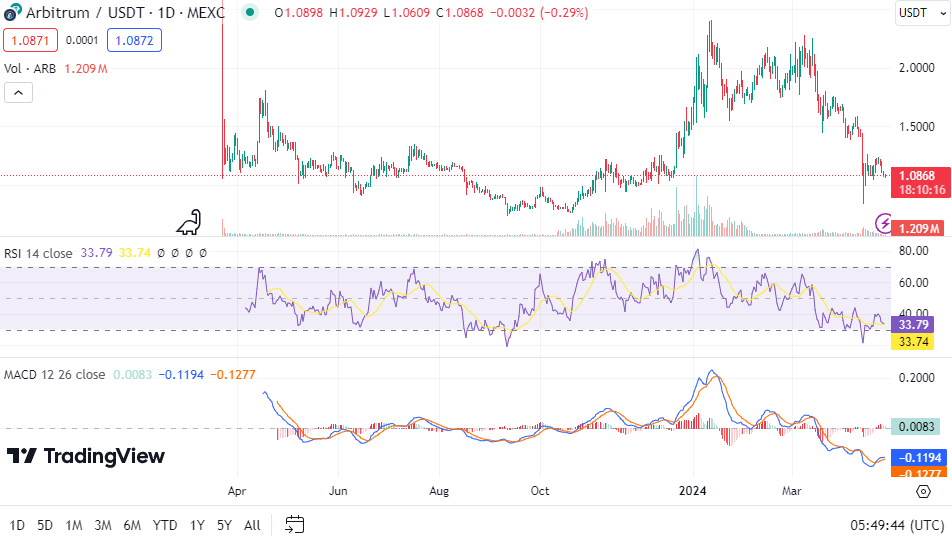
Technical indicators further reinforce the bullish outlook for Arbitrum, with the 1-day Relative Strength Index (RSI) currently reading 33.79. This suggests that the market may be nearing oversold conditions, potentially signaling a buying opportunity for traders. Hence, this could serve as a compelling signal for traders to consider entering the market.
Additionally, the moving averages, including the 50 EMA, 100 EMA, and 200 EMA, indicate a downtrend in the market. However, it’s essential to note that the downtrend might be reaching a point of exhaustion, potentially paving the way for a reversal in price direction.