Solana is experiencing a critical juncture as it grapples with key support and resistance levels. As per Crypto Tony, an analyst, within the weekly timeframe, the landscape appears volatile, marked by significant price swings that have captured the attention of traders and investors alike. The Solana-to-USD pairing is witnessing a crucial phase, with the breach of a pivotal level urging bulls to step in to reclaim momentum.
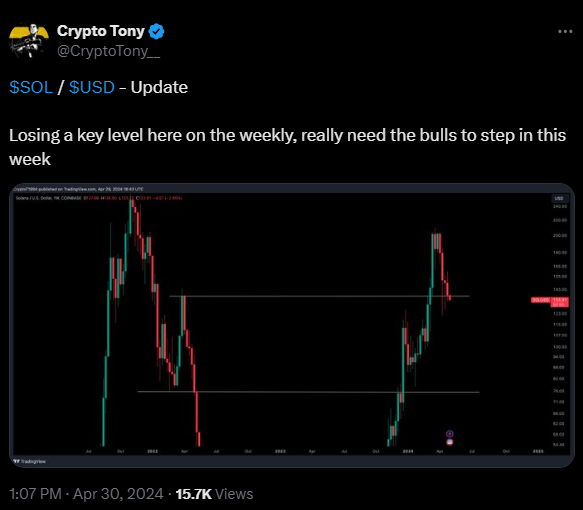
Resistance looms prominently around the $180 mark, delineated by a peak where price reversals have historically occurred. This level is characterized by upper candle wicks grazing or nearing the threshold before retracing, signaling selling pressure. Conversely, support seems steadfast near the $88 mark, evidenced by lower candle wicks indicating buying interest, effectively thwarting sustained downward movements.
Recent price action reveals a notable resurgence from the support level, culminating in a robust upward surge that surpassed a previous resistance at $135. This level now assumes significance as a potential support, with the price hovering in its proximity. Holding above this threshold could signify strength, potentially challenging the upper resistance at $180. Conversely, a breach below may indicate weakness, prompting a retest of the lower support at $88.
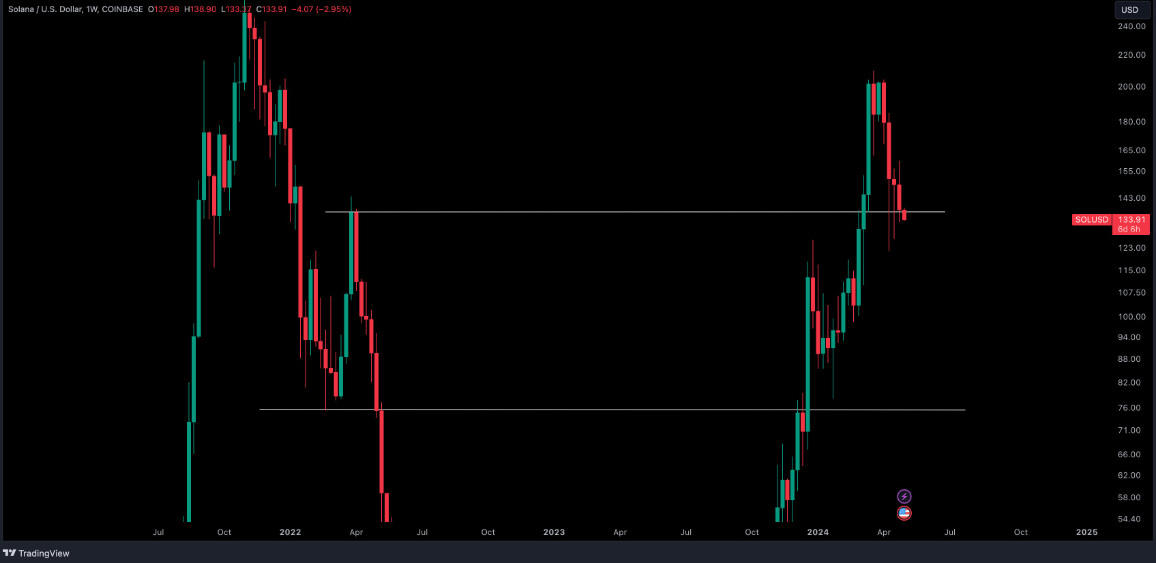
The most recent candles reflect bearish sentiment, with red hues dominating to signify closing prices lower than openings. Candle body dimensions and wick presence offer valuable insights into intra-week price dynamics. Lengthy upper wicks denote rejection at higher levels, indicative of selling pressure exerted by market participants.
The live Solana price is $128.83, with a 24-hour trading volume of $2,948,921,597. Solana has experienced a 4.57% decline within this timeframe, underlining the prevailing bearish sentiment.

Technical indicators further corroborate this outlook, with the 1-day stochastic RSI trading below the signal line, hinting at potential oversold conditions and a subsequent price reversal. Additionally, the 1-day MACD trades below the signal line, suggesting a continuation of the current downtrend, while the 1-day ADX at 34.89 signifies robust trend strength in Solana’s price movement.