
According to crypto analyst el_crypto_prof, the crypto market is experiencing a fresh rally, with the Gooner EMA recently making a bullish crossover. This technical indicator, which has reliably forecasted previous market surges, suggests a robust context for current market expectations.
Historical data underscores the significance of this pattern. For instance, when the Gooner EMA crossed bullish in 2016, the total market cap rose by more than 14,000% to its peak. Moreover, a similar bullish crossover in 2019 led to a market cap increase of over 1,500%.
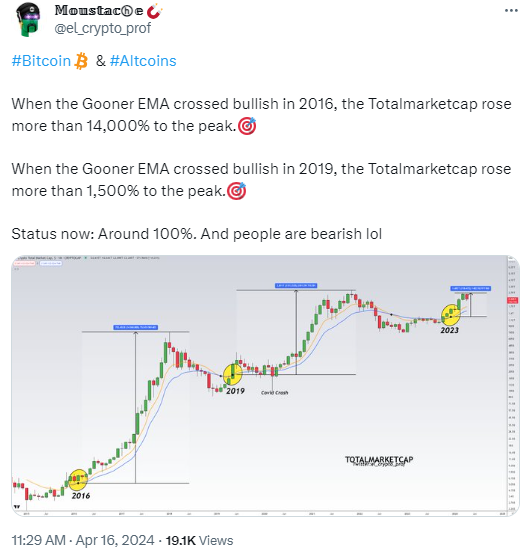
Currently, the total crypto market cap is showing an upward pattern, marked by another bullish crossover in the Gooner EMA. This development indicates that the market might be at the cusp of another significant rally. Historically, such patterns have been precursors to robust market performance, providing a sense of optimism among investors alike.
Moreover, the consistency of the Gooner EMA as a predictive tool gives credibility to the current signals. Hence, the crypto market is poised for another period of notable growth, echoing the rises seen in previous years. Additionally, this trend offers a valuable perspective for both seasoned investors and those new to cryptocurrencies, underscoring the importance of technical analysis in investment strategies.
Technical indicators on the total market cap chart indicate a bullish market. The Relative Strength Index (RSI) is hovering just below the overbought region with a value of 64. However, the trend line is sloping toward the south, suggesting a shift in market dynamics that could lead to a bearish reversal.
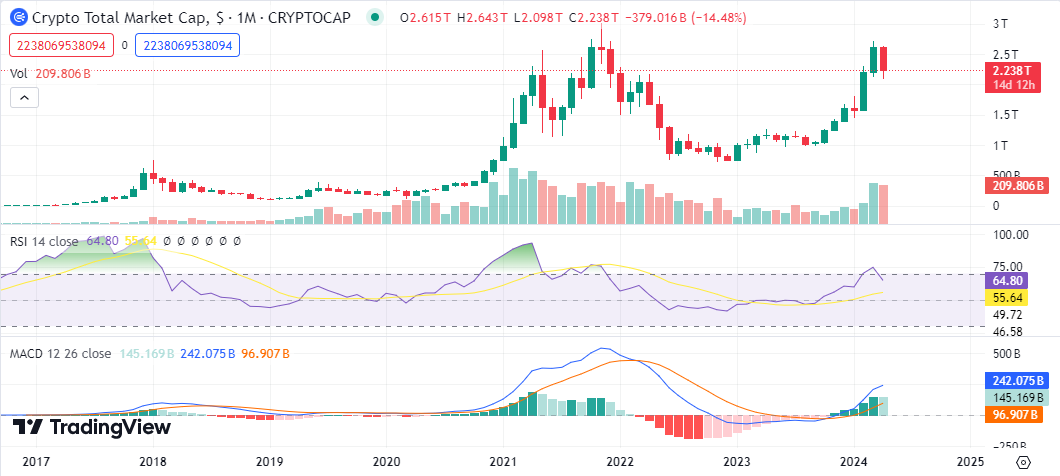
The Moving Average Convergence Divergence (MACD) indicator displays strong bullish momentum. The MACD line remains above the signal line, and the histogram remains in the positive region, with the green bars ruling the chart. However, a bearish trend has been observed forming as the red candlesticks start forming following a stiff rejection at the $2.70 trillion mark.