
Amidst recent Bitcoin surges, bears find themselves in shock and disbelief after their three consecutive bets on a price drop have failed. The latest squeezes, occurring on February 27th, February 28th, and March 4th, have left them reeling. What’s particularly frustrating for the bearish investors is the role of US institutional investors in driving these unexpected spikes.
The Coinbase premium, reaching its highest levels since September of the previous year, underscores the magnitude of US institutional interest. These investors, gripped by FOMO (fear of missing out), are scrambling to secure their positions at the forefront of the Bitcoin rush.
Consequently, the market sentiment is leaning heavily towards bullishness, with little reason to anticipate a significant correction soon. The influx of institutional investment and sustained retail interest paints a bullish picture of Bitcoin’s future trajectory. However, this development is nothing short of a nightmare for the bears banking on a downturn as US institutions’ overwhelming momentum continues to thwart their bets.
As of press time, BTC is exchanging hands at $66,744, up by 2% on the daily chart. Bitcoin has maintained strong support above $65,000, paving the way for another bullish rally. Recently, it surged above $66,000 and is now teetering with the $68,000 level, edging close to its previous all-time high.
Currently, Bitcoin faces immediate resistance around $68,800, whereby a break above this level could potentially touch $69,000 and even breach the $70,000 mark. Further gains could propel it towards $72,000 and possibly $75,000, marking significant milestones in its upward trajectory.
However, if Bitcoin encountered resistance and failed to surpass $68,800, a downside correction might ensue. Initial support lies at $67,000, followed by a crucial level at $66,000. A breach below $66,000 could trigger a substantial pullback towards $65,000, with the $63,000 zone as a key support.
Looking at the technical front, BTC is trading on a strong uptrend. Technical indicators such as the Relative Strength Index (RSI) and Moving Average Convergence Divergence (MACD) indicate that BTC is forming higher and lower highs.
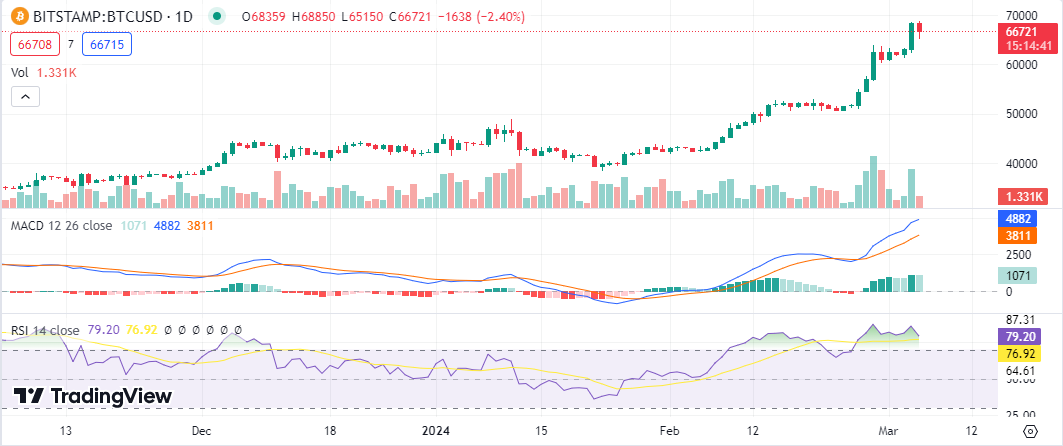
The RSI is at the overbought region and has started to trend downwards, suggesting a decrease in the bullish momentum. This could lead to a price correction if the bears gain market control. The MACD indicator is still positive as the MACD line continues to trend above the signal line, and the green bars rule the histogram.


