Bitcoin Crosses $106K Level Signaling Strength in Market Action

- Bitcoin rebounds above $106K forming bullish momentum after testing strong support zones.
- Winklevoss claims Bitcoin can multiply tenfold, backed by robust institutional demand.
- Coinglass reveals $105K as a liquidation hotspot, signaling intense leveraged positions.
Bitcoin (BTC) recovered sharply on November 10, 2025, closing at $106,404 after rebounding from an intraday low of $104,265 on Binance. The daily chart shows a 1.61% rise, forming inside a descending channel that began in late October. The recovery coincides with the Relative Strength Index (RSI) attempting to break its downtrend resistance, hinting at early momentum toward a short-term reversal.
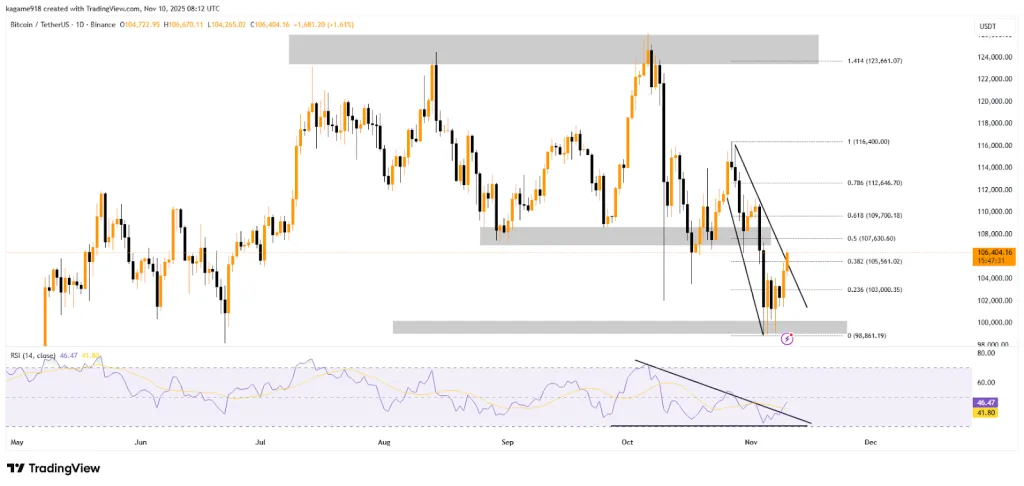
Source: TradingView
Recently, the cost of BTC reached a powerful support area lying between $98,861 and $100,000, which corresponds to the lower boundary of the channel. This zone matches the 0.236 Fibonacci retracement level at $103,000, thus providing a base for the upward movement. On the other hand, Bitcoin faces immediate resistance at $105,561 (0.382 Fib), followed by $107,630 (0.5 Fib), which is higher than its current level.
A breakout past $109,700 (0.618 Fib) might lead to $112,646, which is the 0.786 Fibonacci retracement level. The RSI now sits near 46.47, slightly above its 41.80 moving average, after forming a bullish divergence against lower lows in price. Historically, this pattern has preceded 8–12% rallies when Bitcoin consolidates near demand zones.
Technical Indicators Signal Strength Across Key Zones
The current Bitcoin price is approximately halfway through its recovery area, where the resistance between $109,000 and $116,400 is strongest. This area is significant as it overlaps with the Fib 1.0 extension and the lower highs set in early October. If the buyers take this range, the next target for the upside would be placed around $123,661, which is linked with the Fib 1.414 extension and is also a significant liquidity area.
On the contrary, if the price fails to maintain above $104,000, it could lead to fresh sales and a possible revisiting of the $98,800 support. The chart indicates that Bitcoin has been following a broad wedge formation, suggesting that volatility is decreasing and pressure for the next breakout is building up.
Related: Crypto Market Faces Major Downturn, BTC and Altcoins Plunge
Winklevoss’s $1 Million Bitcoin Call Fuels Optimism
In a CNBC interview, Cameron Winklevoss, co-founder of Gemini, stated that “Bitcoin is an easy 10x from here.” His comments arrive as optimism returns across the digital asset sector. At the same time, Coinbase Global (NASDAQ: COIN) stock gained 0.82%, closing at $326.59, while posting a +313.53% year-to-date climb. Winklevoss made his prediction relying on Bitcoin’s increasing institutional acceptance and strong fundamentals.
Liquidation Heatmap Reveals $105K as a High-Risk Zone
The Bitcoin liquidation heatmap data from Coinglass for the previous week, Binance’s BTC/USDT pair, saw remarkable liquidation activity in the range of $104,000 and $106,000. The map shows bright yellow spots where the liquidation volumes exceeded $80 million, meaning that there were risky trading activities with high leverage ratios.
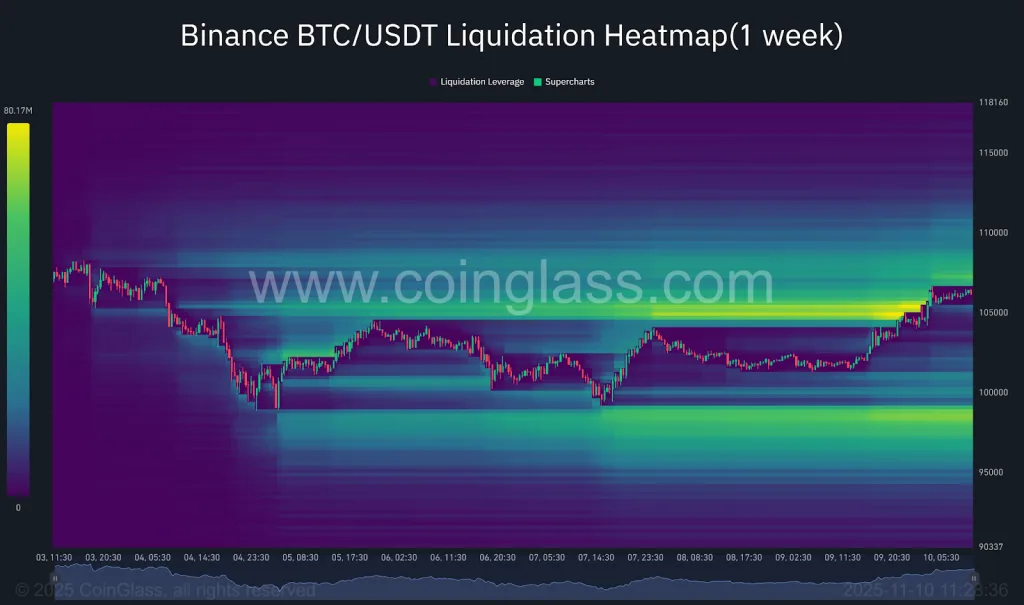
Source: Coinglass
At the beginning of the week, the Bitcoin price dropped and fell below $98,000, but it rebounded strongly, which resulted in many short positions being liquidated around the $100,000 level. Following this, the price has been moving sideways between $103,000 and $106,000, which has led to an increase in long positions as traders expect another price increase.
Liquidation levels are less than $110,000, indicating that there are not many short positions left. This may result in sharp price changes if Bitcoin meets the resistance and breaks it. Currently, the market is becoming increasingly tense as the leverage buildup indicates that the traders are on the edge, balancing risk and reward in a narrowing price range.