As Bitcoin continues to climb, investors have become increasingly apprehensive that prices may not be able to sustain this current rate of growth. The Fear Greed Index hit an unusually high 61 (Greed) on January 30th – close to a one-year high – up from 25 (Extreme Fear) just last month.
This sudden surge in investor confidence has some experts wondering if a market correction could be around the corner.
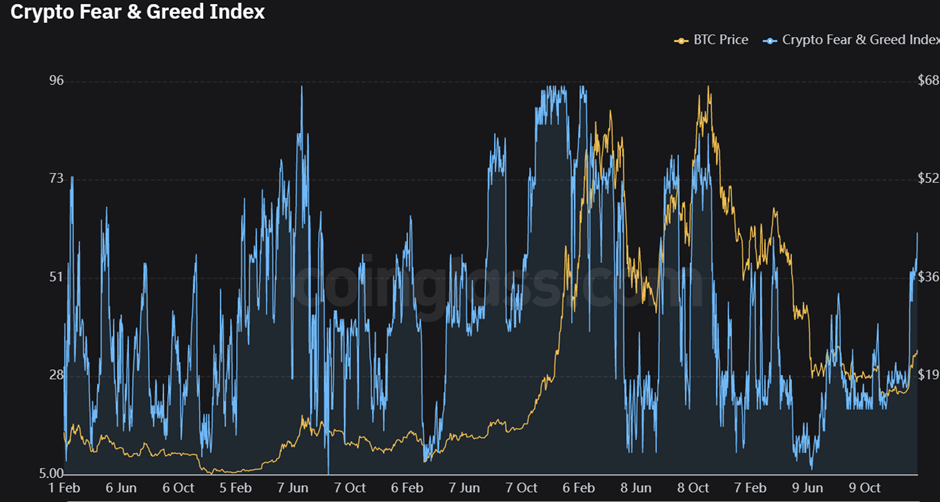
The Fear Greed Index is based on the general sentiment of investors and traders, measuring market behavior to determine the current state of fear or greed.
When the index reaches a high level of greed (60-80), it indicates that investors are overly optimistic about their investments and may be taking too much risk. Conversely, when the index reaches a low level of fear (0-20), it suggests that investors are too fearful and may be missing out on potential gains.
The recent hike in the Fear Greed Index to 61 is likely due to the surge in the price of Bitcoin over the past few weeks. Extreme fear can be a sign that investors are too worried. That could be a buying opportunity. When Investors are getting too greedy, that means the market is due for a correction.
Therefore, we analyze the current sentiment of the Bitcoin market and crunch the numbers into a simple meter from 0 to 100. Zero means “Extreme Fear”, while 100 means “Extreme Greed.”
The current reading of 61 suggests that Bitcoin investors feel confident but not overly so. Bitcoin secured the $23,000 handle as of January 30th, making it the latest peak since January 2022.
While some experts are concerned that this could signify overconfidence and an impending correction, others believe we may see even higher prices soon. The next few weeks will be pivotal in determining the direction of Bitcoin’s value.
Bitcoin’s recent price analysis
Bitcoin’s price action on the 4-hour chart shows a neutral market sentiment after a minor pullback from the recent high of $23,919.89. BTCUSD is trading in a range between $22,600 and $24,100. A break above this range could indicate that investors continue to feel confident about Bitcoin’s future, leading to higher prices.
At the same time, a break below this range could mean that investors are becoming fearful again, and a potential correction could be on the horizon. Bitcoin is trading at $23,265.60, with a 24-hour price change of -0.52%. The king coin has been correcting higher after a bounce from the $22,600 support level.
The recent price surge has seen BTC trade above the 21-day EMA and the 50-day EMA, indicative of an uptrend in the market. The next few weeks should give us a clearer picture of where the market is headed. :
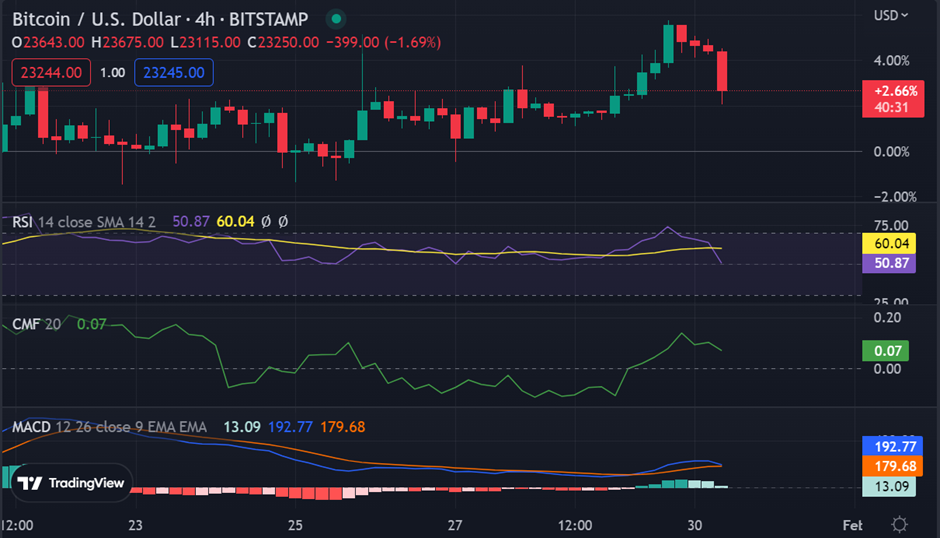
The MACD line shows a bearish divergence from the signal line, indicating that the market is running out of steam. The RSI has also dropped to 59.49, which signifies that we may soon see a price reversal.
The Chaikin Money Flow indicator for measuring buying and selling pressure is trading slightly above the zero line, indicating that there is still some buying pressure in the market. The Money Flow into the market is still slightly above zero, indicating that there is still some buying pressure in the market.
In conclusion, the recent price hike and Fear Greed Index spike have some experts concerned that a correction may be looming. While the market appears to be in a state of extreme greed, it is important to remember that corrections are part of any healthy market.