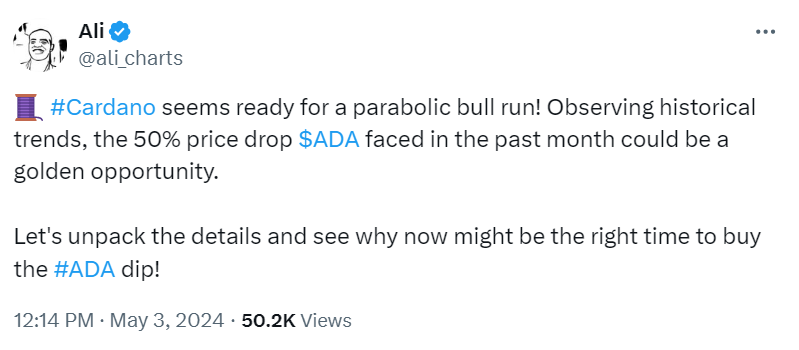
Cardano enthusiasts are eyeing what could be a significant opportunity amidst recent market fluctuations. According to the top analyst Ali Martinez, who has indicated the 50% price decrease in the past one month, the drop might be a sign of the new uptrend for the cryptocurrency.
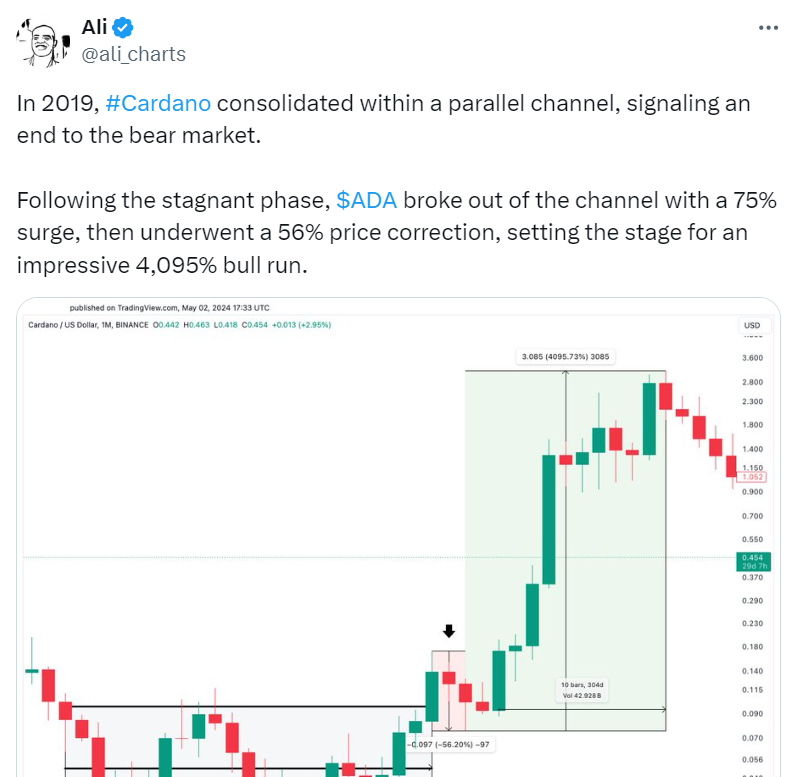
Historical patterns often provide valuable insights for investors, and Cardano’s past performance is no exception. As further noted by Ali Martinez, in 2019, the coin experienced a similar scenario, consolidating within a parallel channel after a bearish period. Following this consolidation, Cardano saw a breakout, accompanied by a surge of 75%. However, this upward movement was followed by a correction of 56%.
In 2023, Cardano was in the same situation being replayed. In the phase of consolidation within a parallel channel, the cryptocurrency had a breakout that brought in a 72% increase in its price. Now, with a 50% correction from recent highs, many are speculating that Cardano could be on the brink of another substantial bull run.
While history doesn’t always repeat itself precisely, there are often patterns and tendencies that rhyme. This has some investors in the mindset that the price correction starting in Cardano may be one of the last opportunities to purchase a dip before an important upward trend.
Analyzing the present status of Cardano, the currency is trading at $0.470535 with a 24-hour volume of $296,933,156. Over the past day, Cardano has seen a modest increase of 2.94%. By looking at technical indicators, the 1-day RSI(Relative Strength Index) is 42.76 which shows that the asset could be getting oversold. Traders typically look for buying opportunities when the RSI drops below 30.
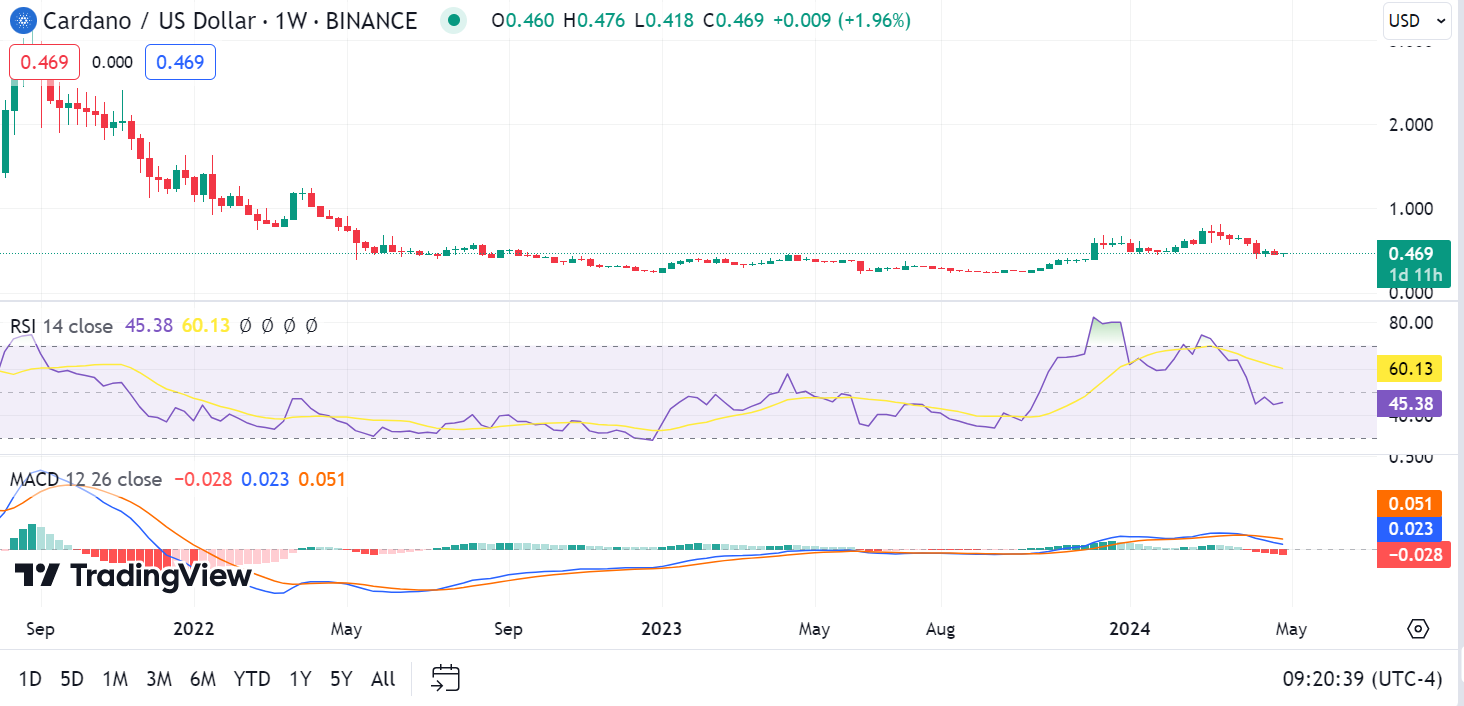
Moreover, the 1-day MACD has been seen above the signal line recently, meaning that there is a bullish trend in the short term. Furthermore, the MACD histogram is above the zero line, signifying that this asset has a positive momentum. The alignment of these markers typically creates a bullish scenario which is usually a strong buy signal for traders who want to take advantage of the promising trend.