Hedera (HBAR) has captured the attention of a prominent crypto analyst, Egrag Crypto, as it showcases an ‘Adam and Eve’ formation on its 3-day chart. This pattern, noted for its reliability in predicting bullish trends, suggests an imminent rise in HBAR’s trajectory, much to the delight of its holders.
The analyst has highlighted several key resistance levels, with the most immediate being at the $0.10 mark, which the price should break through. Maintaining above this level could signal continued bullish momentum. The analysts’ next targets for HBAR are $0.15 and $0.25. In addition, EGRAG has highlighted the $1.272 and $1.414 areas as the major areas in which to take profits.
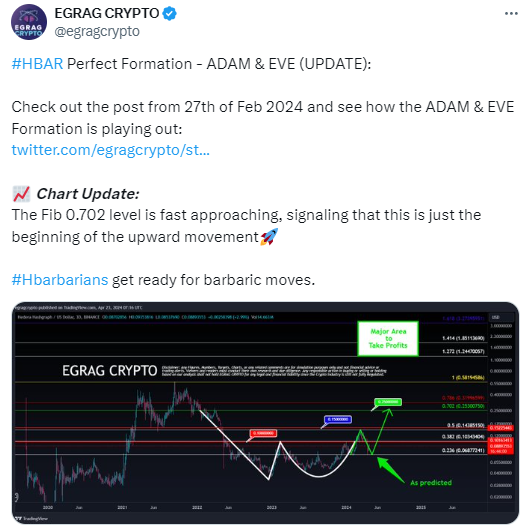
With the Fibonacci retracement level of 0.702 within striking distance, the current ascension may only be the nascent stage of a vigorous rally. According to the market expert, investors should brace for what he has described as barbaric moves ahead, keeping a keen eye on the market pulse.
According to Egrag, the Adam and Eve formation, a double bottom pattern, materializes with striking clarity on the chart. The initial “Adam” bottom is characterized by a sharp, V-shaped recovery, suggesting a rapid rejection of lower prices by the market. In contrast, the “Eve” bottom displays a more gradual and rounded recovery, indicating accumulation and a slower build-up of buying pressure.
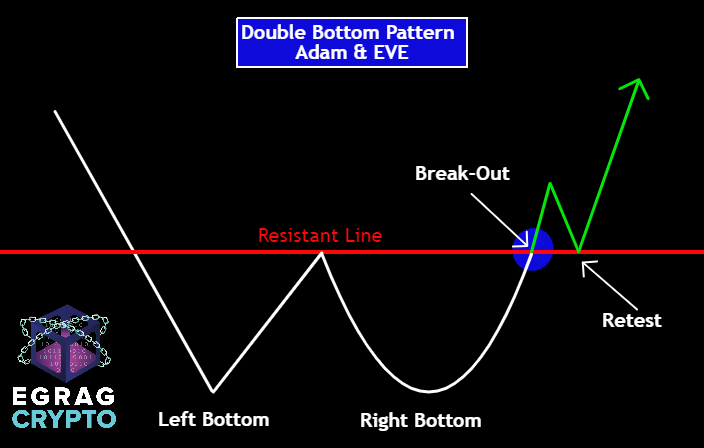
The confirmation of this pattern comes as the price of a coin breaks through the resistant line, a level that previously acted as a barrier to upward price movements. The breakthrough, termed the break-out, is soon followed by a retest, where the price dips momentarily to touch the resistance line from above before resuming its upward trajectory, a move seen by the analyst as a validation of the pattern’s predictive strength.
As of press time, Hedera is trading at $0.08757, down by 3% in the past 24 hours. HBAR has dropped below the $0.0900 key level to seek support at the $0.0870 region amid the bullish sentiment observed in the past week, as it recorded an impressive gain of 9%. The market cap and the trading volume stand at $3.13 billion and $43 million, respectively.