AAVE Breakout Targets $104 as Network Activity Accelerates

- AAVE’s breakout above $86.74 places the $104.63 Fibonacci target firmly in focus.
- Whale transactions climbed to 128 as large-holder activity reached a monthly peak.
- Daily active addresses surged to 2,804 while AAVE extended its late-June recovery.
AAVE has broken above a months-long descending channel as whale transactions and network activity surged, placing the $104.63 Fibonacci level within its projected price range. The Binance daily chart on TradingView showed AAVE at $95.65 after opening near $95, reaching $97, and falling to $92. The session produced a $0.46 gain, equal to 0.48%. Meanwhile, Santiment recorded a large rise in holder transfers and a sharp increase in active addresses.
Breakout Shifts Focus Toward $104.63
AAVE traded inside a falling channel from February through late June. The decline carried the token below Fibonacci levels at $154.14, $133.55, $119.09, and $104.63. Selling pressure later pushed AAVE toward the $57.81 Fibonacci base in early June. Price then recovered into a demand zone between roughly $72 and $79.
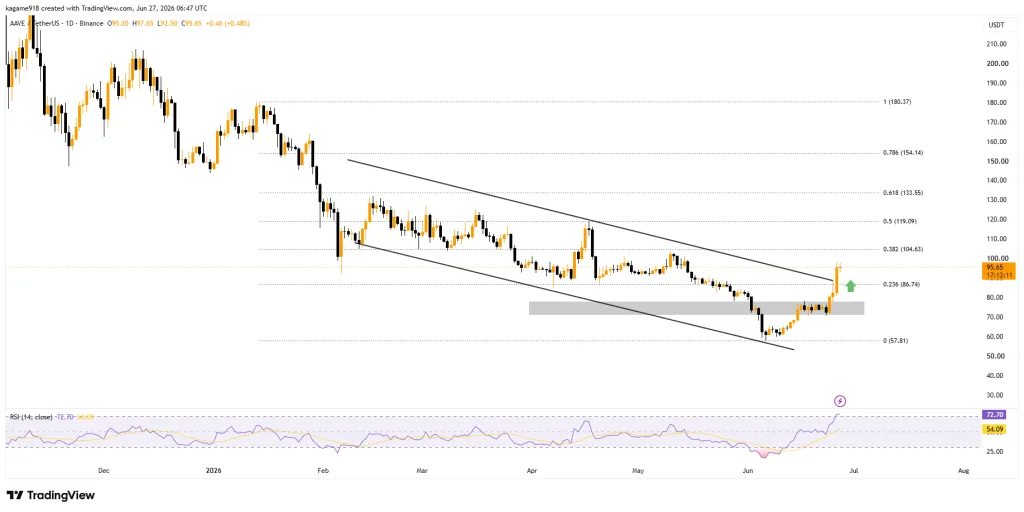
Several June candles were held near that area before a sharp advance cleared the channel’s upper boundary. The move also reclaimed the 0.236 Fibonacci retracement at $86.74. Can AAVE hold $86.74 long enough to test $104.63? The chart identifies that level as the first upside target following the channel breakout.
Momentum also strengthened during the advance. The 14-day relative strength index reached 72.70, while its yellow average stood at 54.09. A sustained move above $104.63 would bring $119.09 into view. The remaining Fibonacci targets sit at $133.55, $154.14, and $180.37.
Whale Transactions Rise Before Price Acceleration
Santiment’s chart showed AAVE climbing from about $72 to $86 between June 24 and June 26. The roughly 20% advance occurred as Bitcoin fell toward $58,000. Transactions worth at least $100,000 previously maintained a baseline of about 30 to 50 daily. They increased to 69 on June 22 and 105 on June 23.
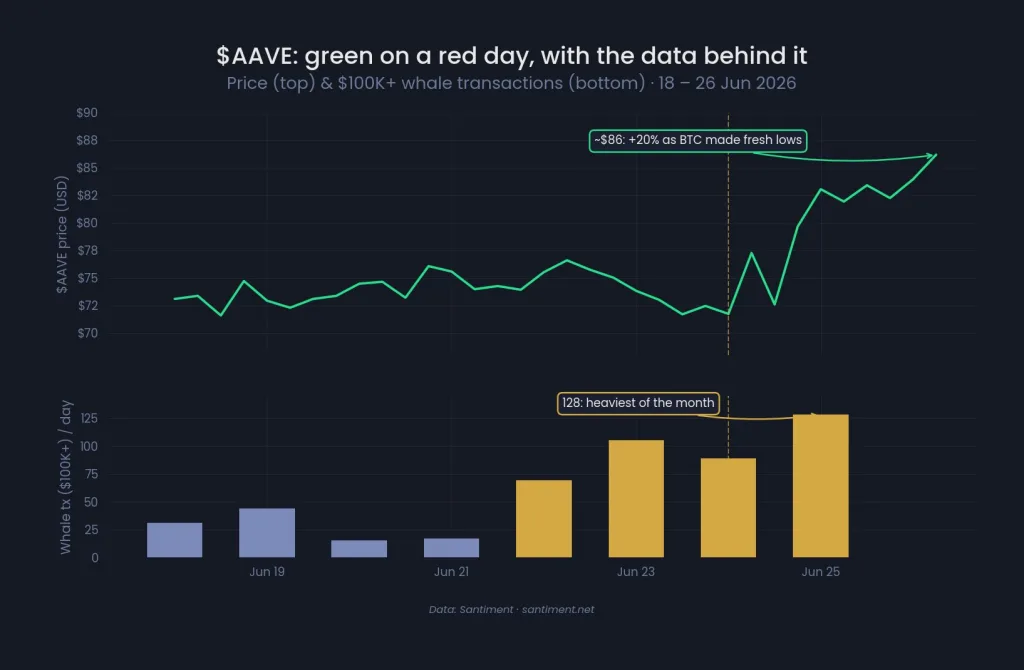
Santiment then recorded 89 whale transactions on June 24 and 128 on June 25. The final reading marked the month’s highest large-holder transaction count. The platform described AAVE as “green on a red day.” It added that the token continued rising overnight as Bitcoin reached fresh lows.
Santiment said most of the market “ran for the exit,” while money entering AAVE “walked in the front door.” Its shorter chart covered June 18 through June 26.
Related: Crypto Trader Burns $50M in AAVE Swap After 99% Slippage
Network Usage Supports AAVE Price Recovery
A second Santiment chart tracked AAVE from March 28 through June 26. Price traded near $97 in late March before reaching approximately $115 during mid-April. AAVE later approached $102 in early May before entering another decline. That retreat carried the token to a June 6 low near $61.
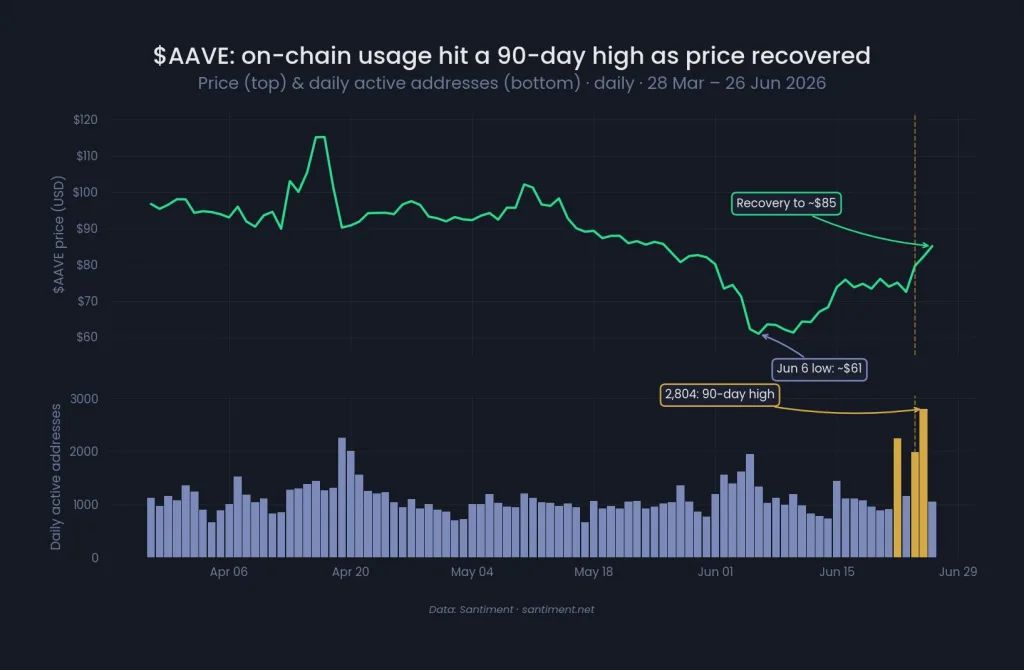
The price subsequently recovered toward the mid-$70 range. The late-June advance then lifted AAVE to approximately $85 on Santiment’s wider chart. Daily active addresses generally ranged between 800 and 1,600. Earlier activity peaks reached nearly 2,250 in April and almost 2,000 during early June.
Active addresses climbed to 2,804 on June 25. Santiment called it the busiest day in 30 days, while the accompanying chart identified a 90-day high. Santiment linked the move to a bullish Standard Chartered initiation and reports involving a Kraken stake. It also noted that Aave’s founder disputed the reported transaction terms.
“The on-chain footprint is real either way,” Santiment said. The chart data showed price, whale transfers, and active addresses increasing during the same recovery period. A failure to defend $86.74 would weaken the breakout structure. Price could then revisit the $72-to-$79 demand zone, while $57.81 remains the chart’s lower reference level.