
Hyperliquid Price Prediction Targets $77 as HYPE Buybacks Lift Demand

- HYPE’s $68 support remains pivotal as the chart projects a $77.24 upside target.
- Hyperliquid’s $116M bridged inflow placed it far ahead of rival listed networks.
- Buybacks reached $878,300 in one day as total HYPE accumulation hit 45.60M tokens.
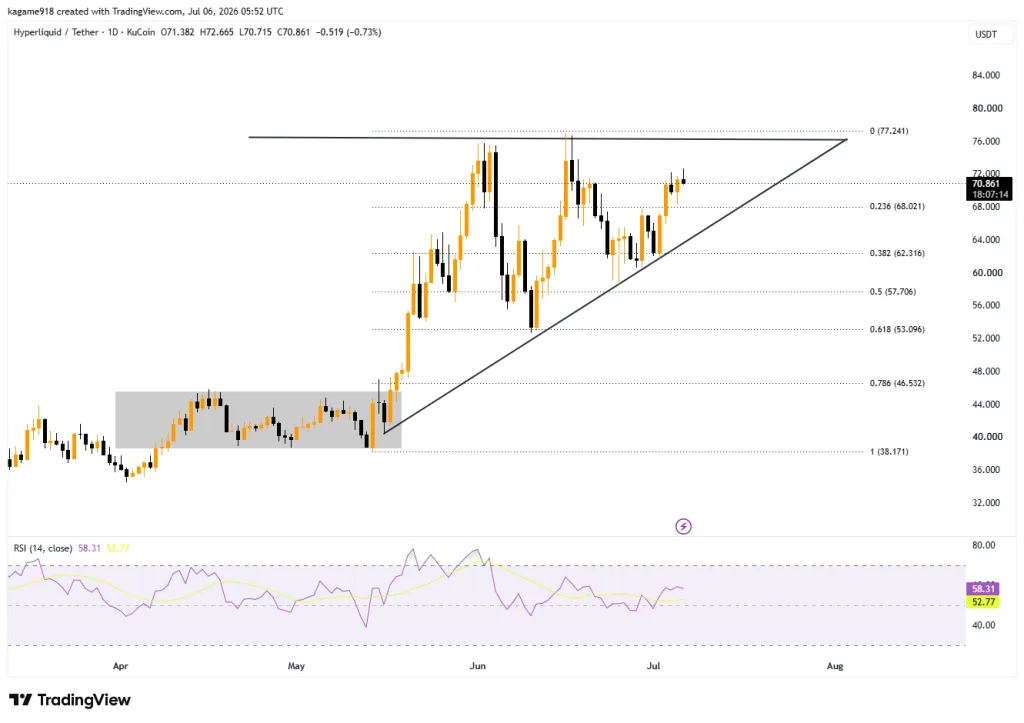
Hyperliquid’s HYPE is at $70.861 on the KuCoin daily chart, while technical levels pointed toward a possible move to $77.241. The chart showed HYPE holding above $68.021, as buyback data and bridged inflows added fresh market attention. The latest daily candle opened at $71.382, reached $72.665, fell to $70.715, and closed lower by $0.519, or 0.73%.
The chart showed a price range from $32 to $84, with the visible timeline running from April to early August. HYPE first moved inside a shaded base between about $38 and $46 from early April to mid-May. Then, the token broke above that range and climbed through the $50 and $60 zones. The chart also showed repeated tests near the $75 to $77 area. This zone now marks the upper resistance region in the current setup.
Source: TradingView
HYPE Holds Above Key Support as Triangle Pattern Points to $77.241
The TradingView chart outlined an ascending triangle, with a flat ceiling near $76 and a rising support line from around $40. That support line extends toward the same resistance zone by early August.
Higher lows on the chart showed steady upward pressure. At the same time, repeated failures below the top line showed that resistance remained active. A Fibonacci retracement from $77.241 to $38.171 placed the first support at $68.021. Other marked levels stood at $62.316, $57.706, $53.096, and $46.532.
The 14-day RSI stood at 58.31, above its yellow average of 52.77. Because the RSI stayed below 70, the chart showed positive momentum without entering the overbought zone. Based strictly on the displayed structure, the near-term price prediction stands at $77.241. A break above the triangle ceiling would confirm that target, while a fall below $68.021 would weaken the setup.
Buybacks and Inflows Strengthen the Market Story
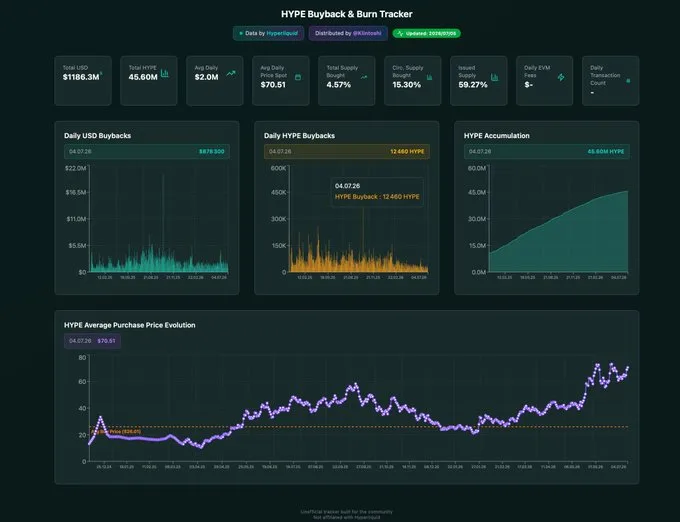
Market analyst The Ghost posted a HYPE buyback & burn tracker on X. Beside the image, the analyst said, “$HYPE buybacks & burns 2026/07/04 – $878,300.” The tracker, marked as data by Hyperliquid and distributed by @Klintoshi, showed an update date of July 5, 2026. It listed total USD buybacks at $1.1863 billion
Source: X
The same dashboard showed 45.60 million HYPE accumulated through the program. It also placed average daily buybacks at $2.0 million and the average daily purchase spot price at $70.51. Buybacks represented 4.57% of total supply and 15.30% of circulating supply. Issued supply stood at 59.27%, while daily EVM fees and daily transaction count appeared unavailable.
The daily USD buyback chart showed $878,300 in buybacks on 04.07.26. The daily HYPE buyback chart recorded 12,460 HYPE purchased on the same date. The HYPE accumulation chart rose steadily to 45.60 million HYPE. Meanwhile, the average purchase price chart placed HYPE at $70.51, far above the dashed average buy price of $26.01.
Related: Hyperliquid Will Be “Used Forever,” Says Founder Jeff Yan
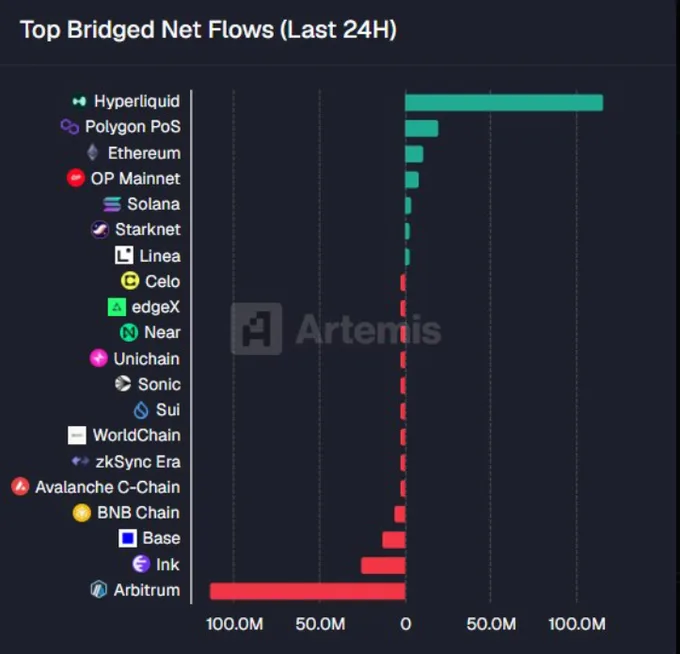
Whale Factor also posted an Artemis chart on X showing top bridged net flows over the last 24 hours. The account said, “Hyperliquid pulled $116M in net bridged inflows in 24 hours. That’s not a spike. The velocity is increasing.” The chart showed Hyperliquid leading all listed networks, with its bar extending beyond the $100 million mark. Polygon PoS followed with a smaller inflow, while Ethereum and OP Mainnet also showed positive net flows.
Source: X
Solana, Starknet, and Linea posted modest positive bars near zero. In contrast, Arbitrum showed the largest outflow, close to the negative $100 million region. Ink, Base, BNB Chain, Avalanche C-Chain, zkSync Era, WorldChain, Sui, Sonic, Unichain, Near, edgeX, and Celo also appeared weaker or negative. Together, the buyback activity, accumulation trend, and bridged inflows formed the visible cause behind HYPE’s price increase.